Project portfolio

Sureeporn Kromthin

Automation & Industrial Software Engineer

skn.automationeng@gmail.com · Chonburi, Thailand · open to relocation

Licence & certifications

  • Associate Engineer licence — Chemical Engineering — Council of Engineers Thailand, Apr 2026
  • National Skill Standard — Programmable Logic Controller, Level 1 — Department of Skill Development, Ministry of Labour, Jul 2025
  • Application of Advanced PLC — 30 hours — Chon Buri Institute for Skill Development, Jun 2025
  • SIMATIC PCS 7 Basic Training — Siemens Thailand, May 2023

Contents

Industry projects

  1. End-of-Line Test Stands — Traceability & OT/MES Integration — MIAC Automation, Sep 2025 – Present
  2. Process Identification & PID Tuning Tool — MIAC Automation, Jun 2025 – Oct 2025
  3. PLC-to-PLC Data Exchange — S7-1200 and S7-300 over PUT/GET — P.A.M Engineering & Automation, Jan 2024 – Dec 2024
  4. Hospital Energy Monitoring & Electricity Cost Calculation — P.A.M Engineering & Automation, Jan 2024 – Dec 2024
  5. Bulk-Bag Filling Line — PLC and HMI from Infeed to Outfeed — P.A.M Engineering & Automation, Jun 2024 – Sep 2024
  6. Keg Line Control Upgrade — S7-300 to S7-1500 Retrofit — P.A.M Engineering & Automation, Sep 2023 – Jul 2024

Education & lab systems

  1. Process Control Cloud Lab — Simulink to InfluxDB & Grafana on AWS — Pranakorn Energy (part-time), Jun 2026 – Present
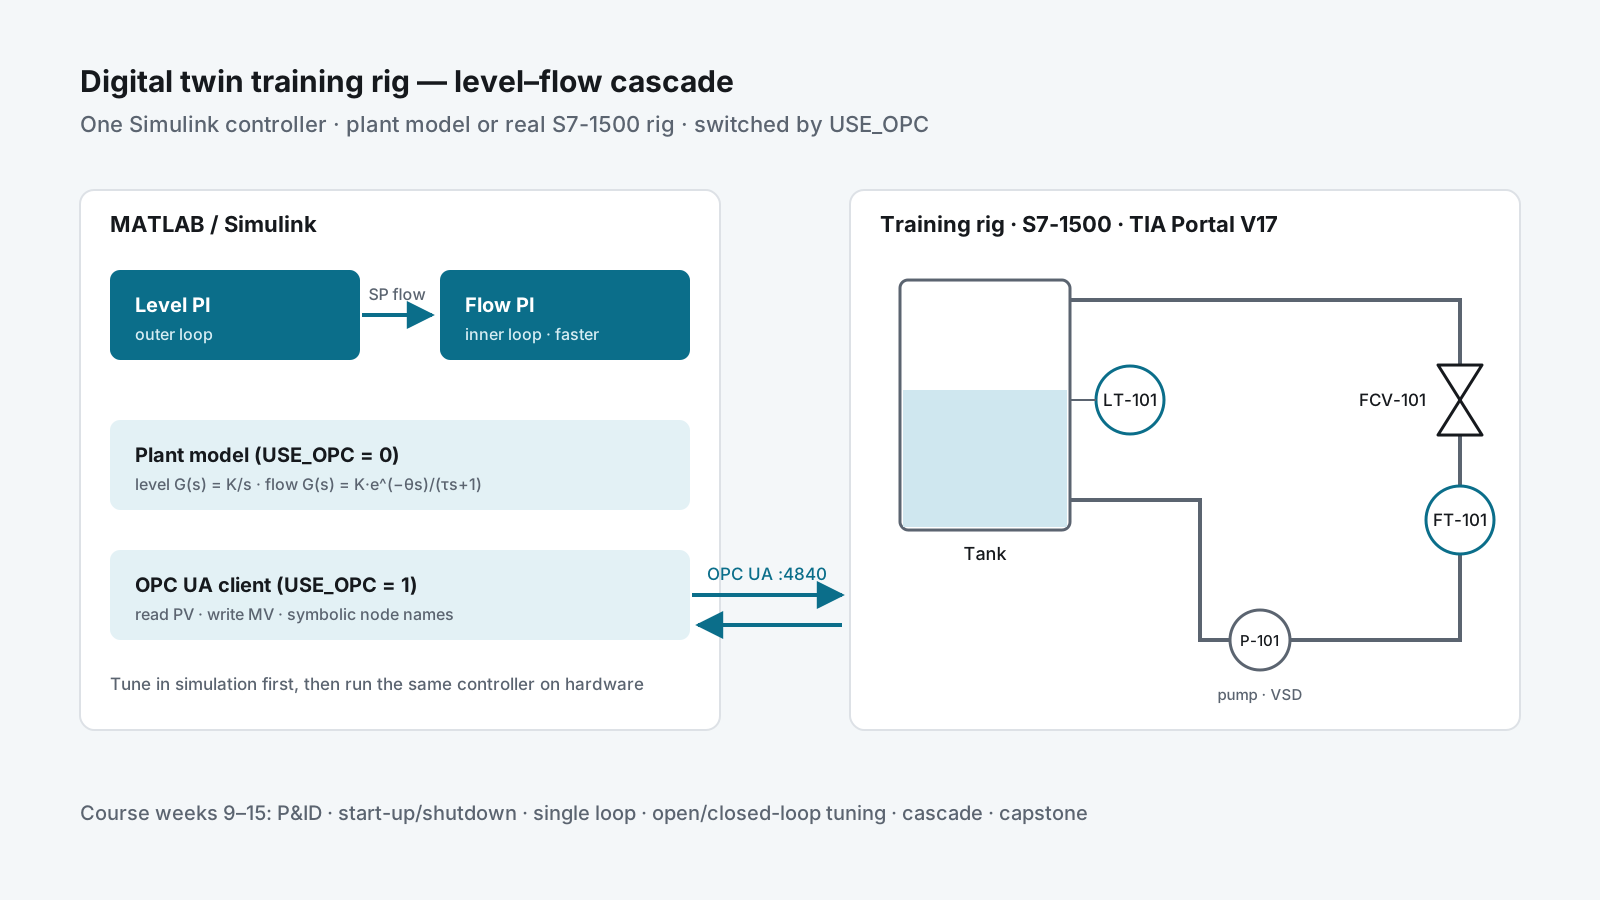
  2. Digital Twin Training Rig — S7-1500 and Simulink over OPC UA — Pranakorn Energy (part-time), May 2025 – Jun 2026
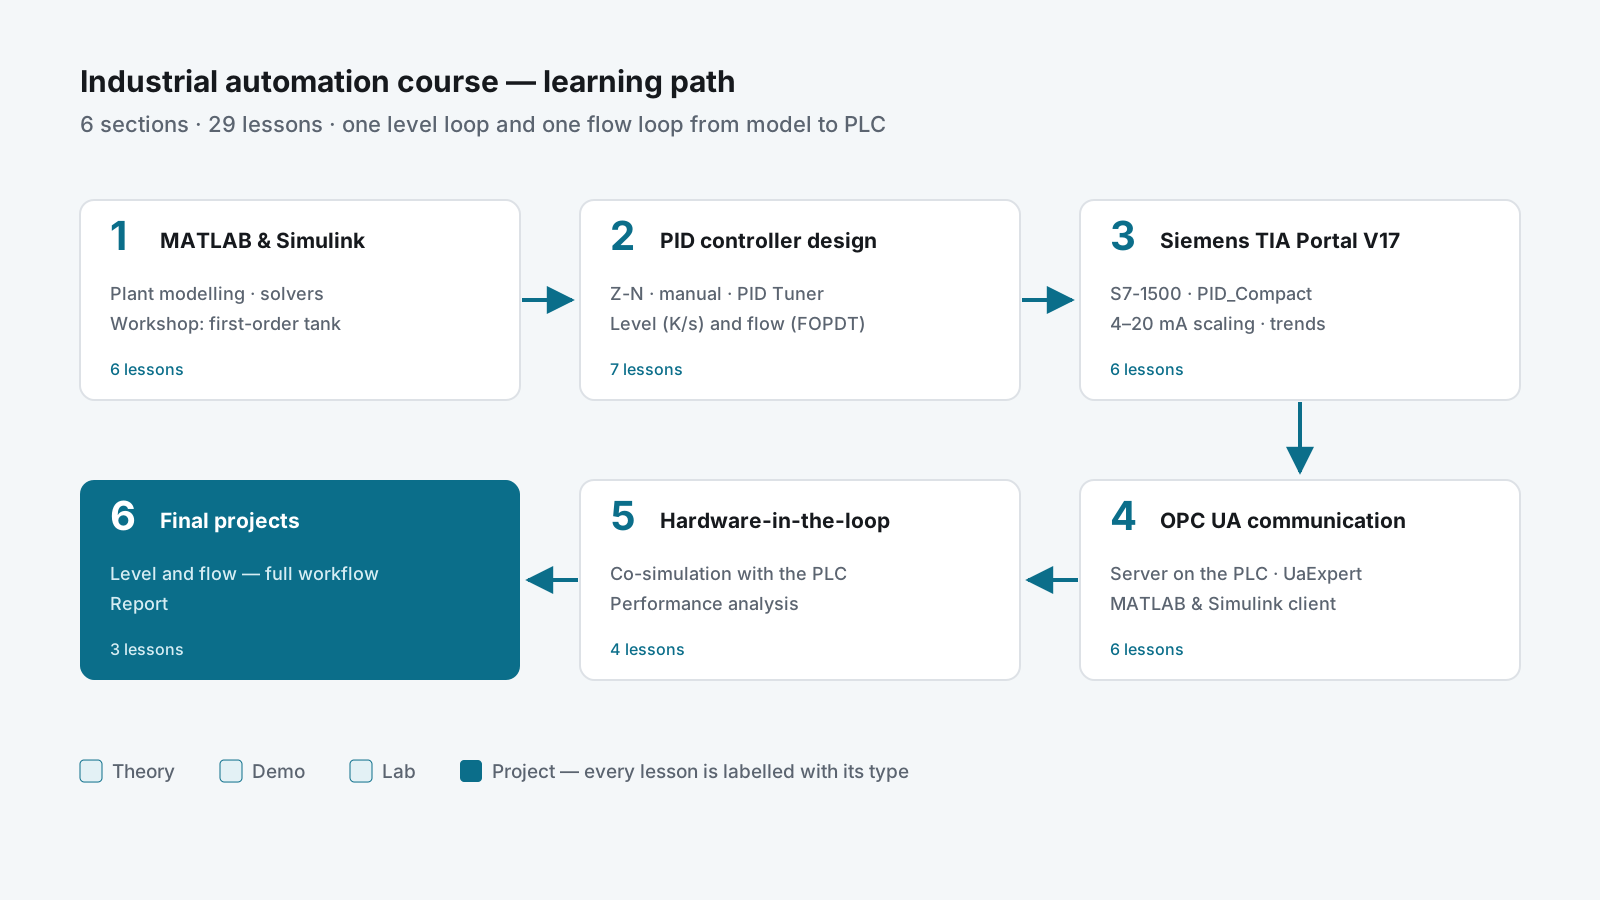
  3. Industrial Automation Online Course — MATLAB/Simulink to PLC over OPC UA — Pranakorn Energy (part-time), Jan 2026 – May 2026
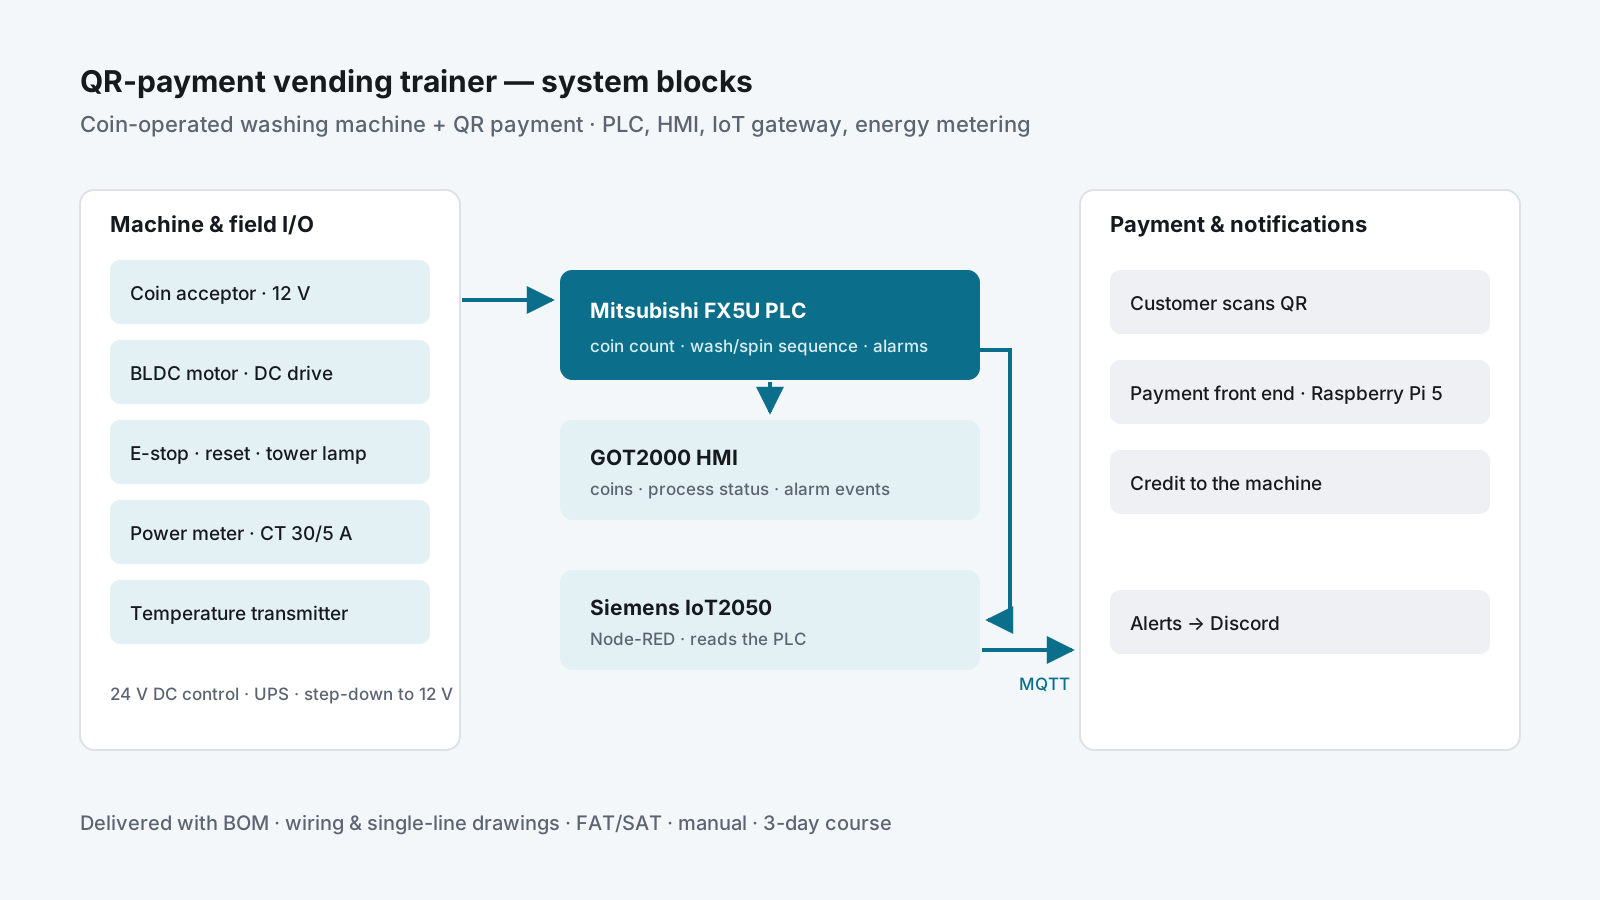
  4. QR-Payment Vending Trainer — PLC, HMI and IoT Gateway — Pranakorn Energy (part-time), Jan 2025 – Dec 2025
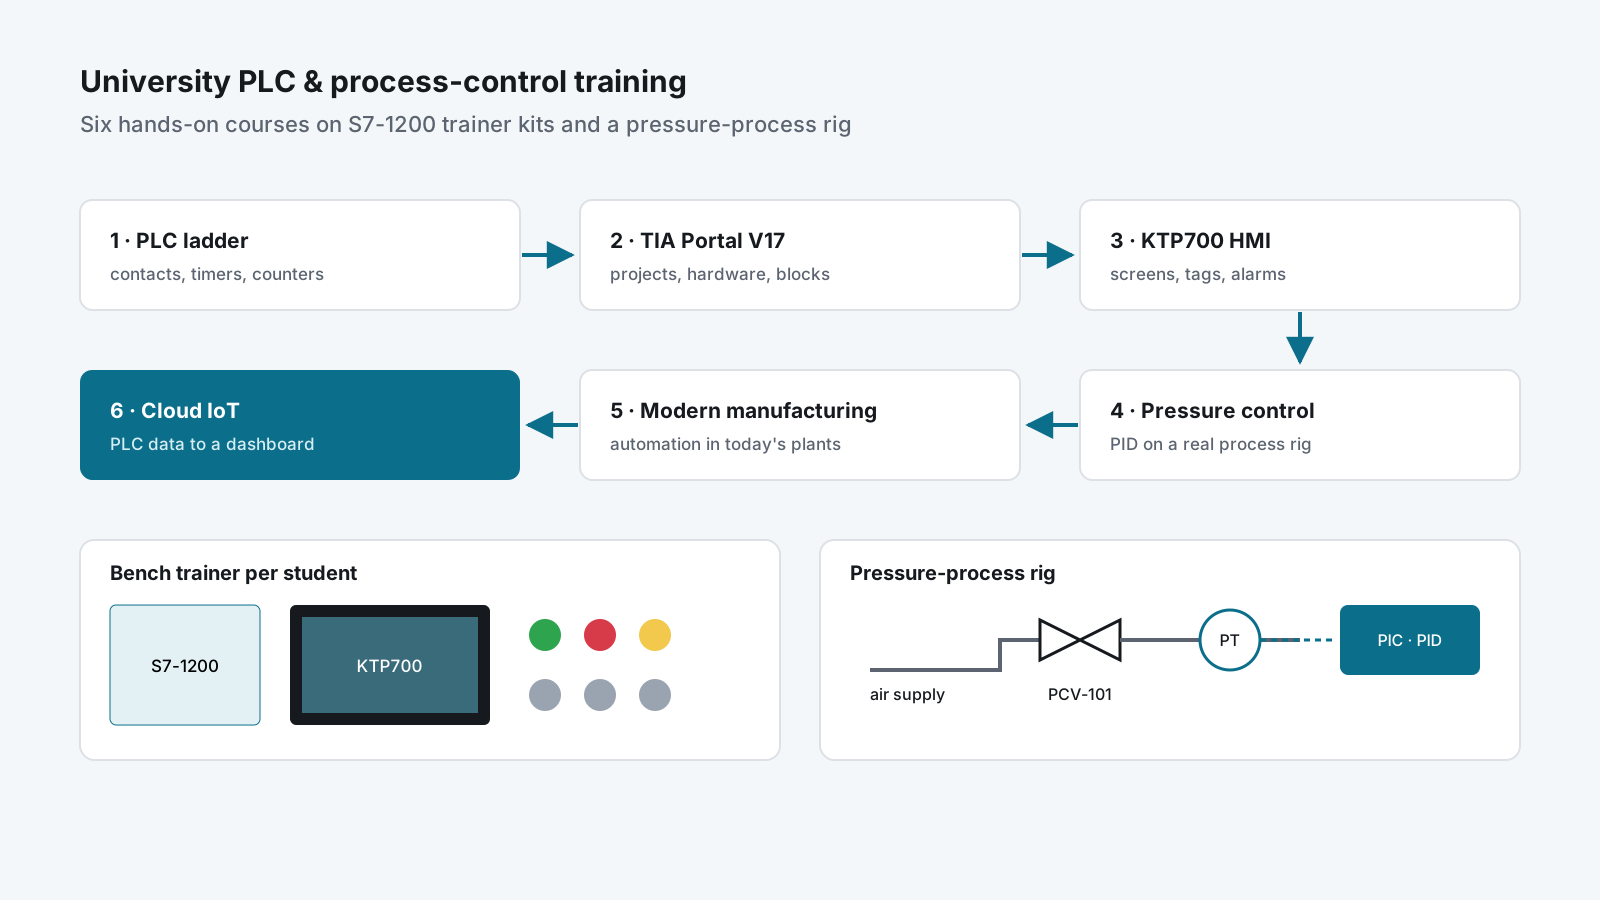
  5. University PLC & Process-Control Training Courses — P.A.M Engineering & Automation, Aug 2023 – Sep 2023
  6. B.Eng. Thesis — MPC-Based PID Control of a Pressure Process (Phase I) — KMUTNB — B.Eng. thesis, Jun 2022 – Mar 2023

Client names are withheld and screenshots are redacted.

Appliance manufacturing — end-of-line functional test

End-of-Line Test Stands — Traceability & OT/MES Integration

A request/response contract between test-stand PLCs and a MySQL MES, so a new product model is a database row instead of a logic change.

Role
Lead controls & software engineer — PLC, HMI, database, integration design
Company
MIAC Automation
Period
Sep 2025 – Present
Platforms
Rockwell ControlLogix · FactoryTalk Optix (C# / .NET 6) · Ignition · MySQL
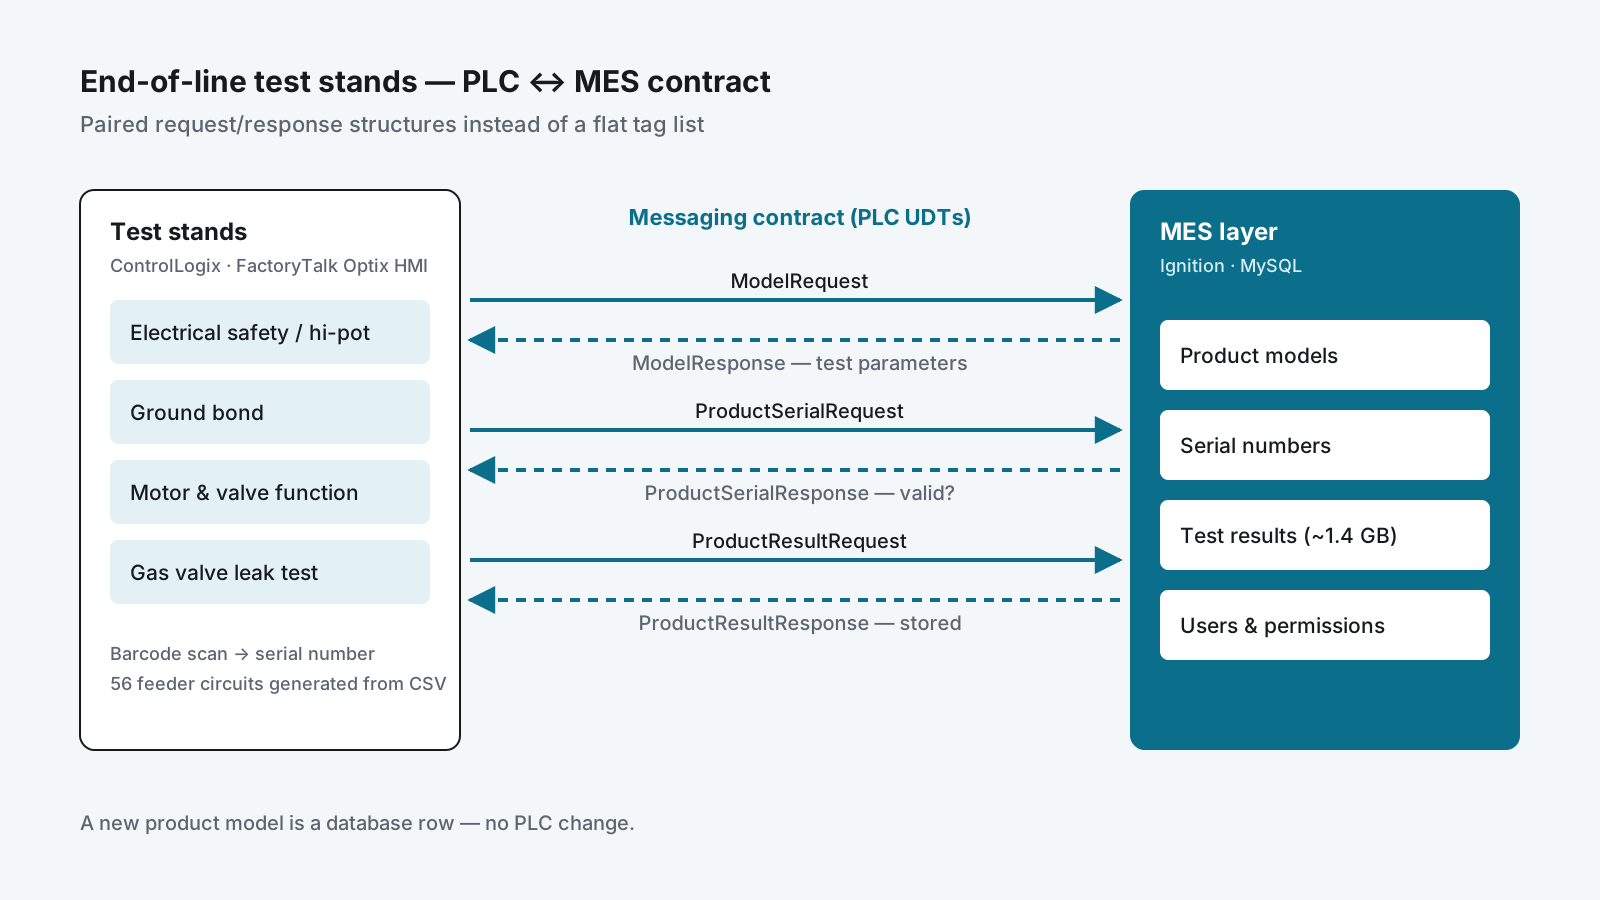
Diagram of test-stand PLCs exchanging model, serial and result request/response messages with an Ignition and MySQL MES layer.

Highlights

  • PLC ↔ MES interface designed as paired request/response structures
  • Serial-level traceability database that grew to about 1.4 GB
  • 56 feeder-selection routines generated from a CSV instead of hand-coded
  • Found an E-stop wiring contradiction before energisation

Problem

A manufacturing line ran multiple end-of-line test stands — electrical safety, ground bond, hi-pot, motor and valve function, gas valve leak test — across several station types. Each stand tested a different product model, each model needed different parameters, and every unit tested had to be traceable by serial number afterwards.

The stands had grown up independently. Test parameters lived in PLC constants, results were recorded inconsistently, and adding a product model meant editing ladder logic.

My role & scope

Lead engineer for the controls and software side: PLC data structures and logic, the FactoryTalk Optix HMI recipe code, the MySQL schema, and the interface design between them. Also the cross-check of the electrical package against the logic.

Approach

1. A messaging contract between PLC and MES, not a tag list

The usual way to connect a PLC to a database is to expose a flat pile of tags and let the SCADA layer scrape them. That couples the two systems permanently and breaks quietly.

Instead I defined the interface as paired request/response structures — a small, explicit protocol implemented as PLC user-defined types:

Exchange Purpose
ModelRequest → ModelResponse PLC asks “what are the test parameters for this model?”
ProductSerialRequest → ProductSerialResponse PLC asks “is this scanned serial valid, and what is it?”
ProductResultRequest → ProductResultResponse PLC posts a completed test result and gets an acknowledgement
UserRequest → UserResponse Operator authentication and permission level

Supporting types (TestStandCommand, TestStandStatus, TestStandData, TestStandParameter, TestStandHMI, TestStandSCADA, TestStandStatic) separate what the operator touches, what the system reports, and what is configuration.

Why this matters: the PLC no longer knows or cares that MySQL is on the other end. Adding a product model is a database row, not a logic change. The database can be migrated, and the handshake can be tested from either side independently.

2. Recipe management driven from the plant floor

On the HMI side (FactoryTalk Optix, C# / .NET 6) I extended the recipe subsystem so that recipe operations — select, save, load-from-PLC, apply, import, export, delete — are each driven by a trigger variable the PLC can set, not only by a button an operator presses.

This lets the machine sequence itself request a recipe change at the correct point in the cycle, with the HMI as the executor rather than the gatekeeper, while keeping full operator control and error feedback in the UI.

3. Configuration-driven PLC code generation

One station family needed 56 power feeder circuits across two test stands, selected at runtime by the full-load current of the model being tested.

The existing logic compared FLA to a single constant — workable for one circuit, impossible for 56. The electrical drawings gave only a single rating per circuit, not a range.

I derived the selection bands algorithmically: within each station / voltage / phase group, circuits were sorted by rating, and each circuit covers from just above the previous circuit’s rating up to its own. That mapping lives in a CSV (FLA_Min / FLA_Max per circuit), and the PLC routines are generated from the CSV.

A rating change is a CSV edit and a regenerate — not 56 hand-edited rungs.

4. Designed so it could be imported before the hardware existed

The physical I/O tree did not yet exist in the project when the logic was written. Rather than block, I wrote all logic against an I/O image and confined every real module reference to a single mapping routine — 17 rungs, each commented with exactly what it must become.

The export imported and verified cleanly on day one, and when the I/O tree was built, only one file needed to change.

Delivery

While cross-checking the electrical package against the logic I found a direct contradiction in the emergency-stop wiring for one of the two stations:

Safety relay drawing Digital input schedule
Station A Safety relay contact → module bit 7, labelled E-STOP (safety relay) consistent
Station B Safety relay contact → equivalent module bit 7 labelled “SPARE”

Two controlled documents disagreed about whether an input was an emergency stop or unused. I took the safety relay drawing as authoritative — it describes physical wiring, while the I/O schedule is a derived document — implemented accordingly, and documented the decision with the exact single rung to change if the drawing was the wrong one.

I raised this together with five other items I could not resolve from the documentation rather than guessing on any of them. I also found three tags referenced by the existing control-module routines that had never been declared, meaning the original program could not have verified. Those were created with driving logic.

Result

  • Product models, test parameters and results moved from PLC constants to a database that reached ~1.4 GB of production traceability data
  • Serial-level traceability from barcode scan to stored test result
  • New product models added without touching PLC code
  • Feeder logic maintainable as data rather than as 56 hand-written branches
  • A documented, reviewable handover — decisions and open questions written down

Skills used

Rockwell Studio 5000 (UDT and AOI design, ladder) · FactoryTalk Optix NetLogic in C# / .NET 6 · MySQL schema design · Ignition · code generation from configuration data · electrical schematic and I/O schedule review · functional-safety awareness.
  • #MES
  • #Traceability
  • #PLC
  • #HMI
  • #Database

Process control — commissioning tools

Process Identification & PID Tuning Tool

A web tool that fits a FOPDT model to step-test data from the plant historian and turns it into IMC-tuned controller settings, with fit quality reported.

Role
Sole designer and developer
Company
MIAC Automation
Period
Jun 2025 – Oct 2025
Platforms
Python · SciPy · pandas · Plotly · Streamlit · InfluxDB
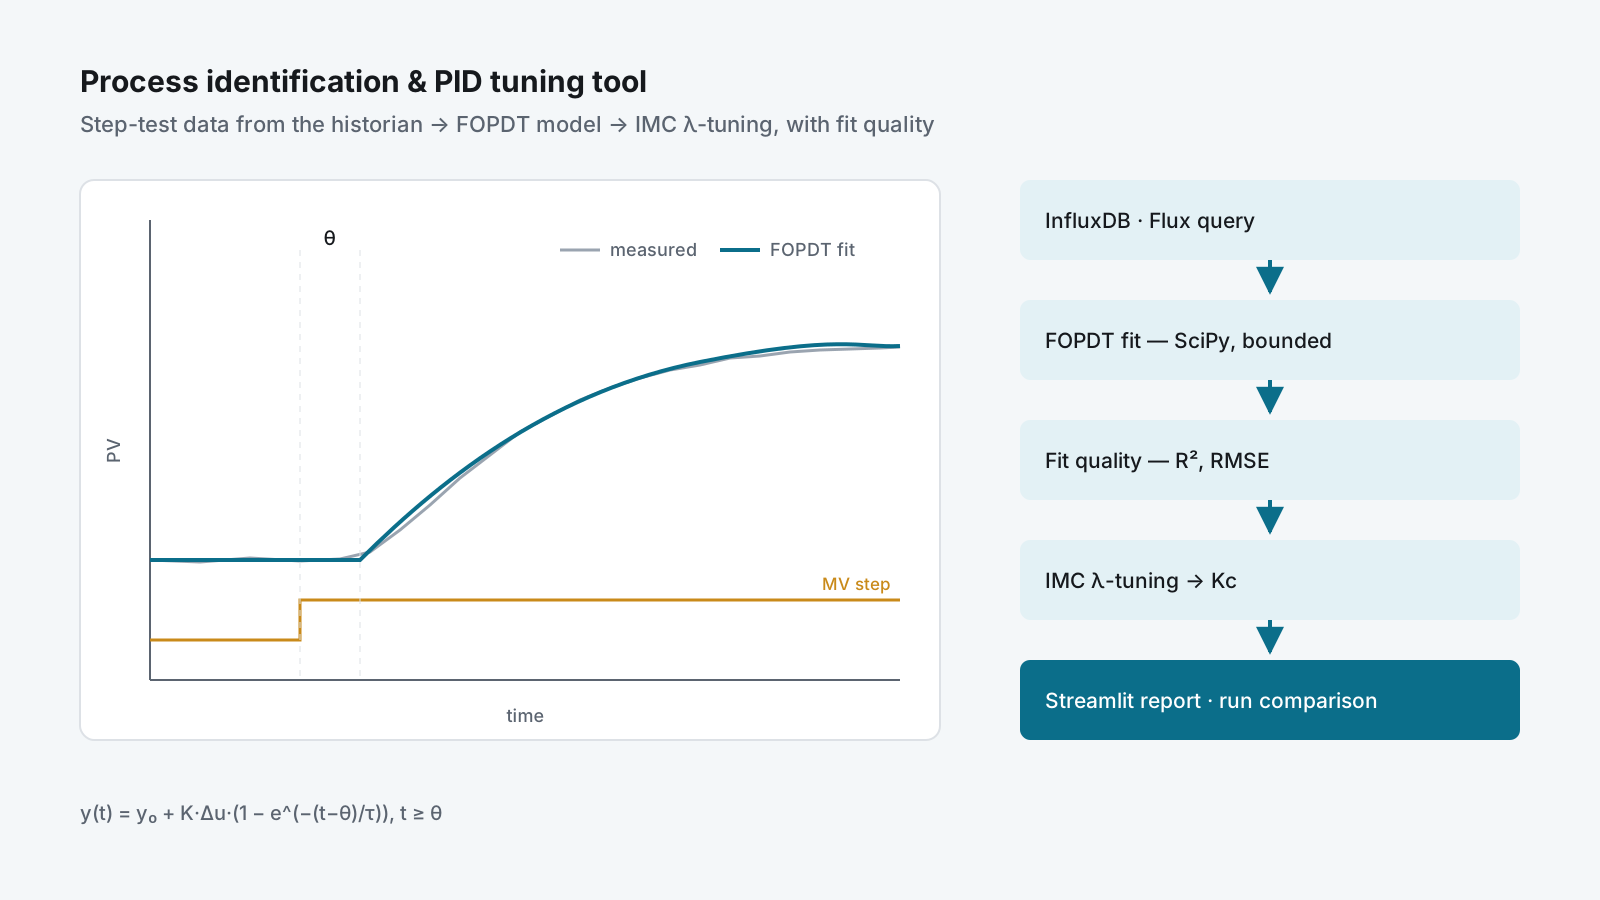
A measured step response with a fitted first-order-plus-dead-time curve, beside the tool's pipeline from InfluxDB to the tuning report.

Highlights

  • FOPDT fit seeded from the graphical 28.3 % / 63.2 % method, then refined
  • Every tuning result is reported with R² and RMSE
  • Multiple step tests compared side by side to track loop health

Problem

PID loops on plant get tuned by feel. An engineer bumps the output, watches the trend, adjusts a gain, and moves on. The result is undocumented, unrepeatable, and impossible to compare between loops or between commissioning visits.

Meanwhile the data needed to do it properly is already being historised — the step tests are recorded, nobody analyses them.

My role & scope

Sole designer and developer: the numerical core, the historian queries and the web interface. Used for analysis of cascade control loops.

Approach

A web tool that reads step-test data straight out of the process historian, fits a first-order plus dead-time model to it, reports how good the fit actually is, and produces tuning parameters from that model.

InfluxDB (Flux query)  →  step-response series
        ↓
FOPDT model fit (SciPy curve_fit, bounded, seeded)
        ↓
Fit quality (R², RMSE)  +  performance metrics
        ↓
IMC λ-tuning  →  controller gain
        ↓
Multi-run comparison table + overlaid Plotly trends

Model identification

The process is fitted to a first-order plus dead-time model:

y(t) = y₀ + K·Δu·(1 − e^(−(t−θ)/τ))    for t ≥ θ

Rather than throwing the raw data at an optimiser and hoping, the fit is seeded from a classical graphical estimate — the 28.3 % and 63.2 % response crossings give a starting τ and θ — and then refined by bounded non-linear least squares. Bounds keep the gain sign consistent with the move direction and keep dead time physically plausible. If the optimiser fails to converge, the tool falls back to the graphical estimate rather than returning nothing.

Reported metrics

Group Values
Model K (process gain), τ (time constant), θ (dead time)
Fit quality R², RMSE — is this model worth trusting?
Tuning λ (IMC filter time), Kc (controller gain)
Response rise time (10→90 %), settling time (±2 %), overshoot %, error at 3τ
Test conditions MV before/after, ΔMV, PV before/after

A tuning number without an R² beside it is an opinion; with one, it is a measurement.

Comparison workflow

Multiple runs are loaded as named tests, each with its own measurement, field and time window, then compared side by side in one table with trends overlaid. That answers “did this loop degrade since last year?” and “which of these tuning candidates is actually better?” with evidence. The λ factor is adjustable, so the speed-versus-robustness trade-off is a visible choice.

Delivery

Working tool, used for analysis of cascade control loops. Planned hardening:

  • Configuration via environment variables rather than in-code defaults
  • Type hints and a pytest suite over the numerical core
  • Core library separated from the Streamlit UI so it can be called from a pipeline
  • Containerised deployment alongside the historian

Result

  • Loop tuning backed by a fitted model and a fit-quality figure, not by feel
  • A record of each step test that survives the site visit
  • Side-by-side comparison of runs to see loop degradation over time

Skills used

Process control theory (FOPDT identification, IMC λ-tuning, cascade loops) · Python — SciPy, pandas, Plotly, Streamlit · InfluxDB / Flux · turning control theory into a tool commissioning engineers can use on site.

  • #Process control
  • #Python
  • #Data
  • #Tools

Dairy — food production

PLC-to-PLC Data Exchange — S7-1200 and S7-300 over PUT/GET

Linked a newer S7-1200 to an existing S7-300 in a dairy plant with S7 PUT/GET communication, so the two controllers share data over Ethernet instead of extra hardwired signals.

Role
PLC programmer — PUT/GET communication between the two controllers, testing on site
Company
P.A.M Engineering & Automation
Period
Jan 2024 – Dec 2024
Platforms
Siemens S7-1200 · Siemens S7-300 · TIA Portal V17 · S7 communication (PUT/GET) · PROFINET
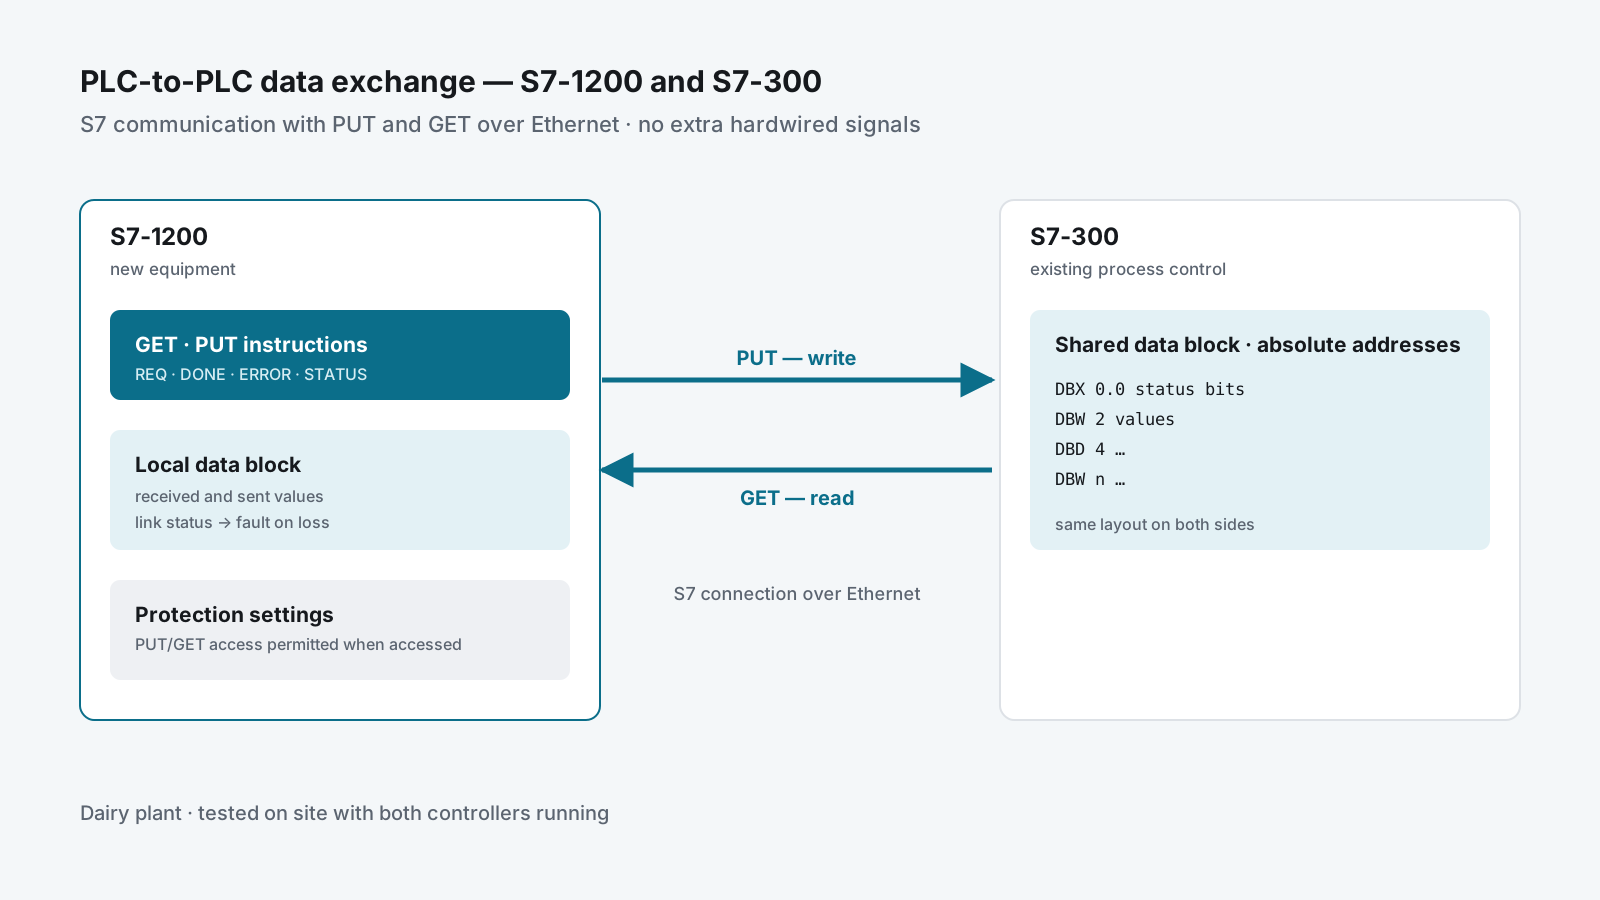
An S7-1200 and an S7-300 exchanging data blocks over Ethernet with PUT and GET, each block at fixed addresses on both sides.

Highlights

  • Two generations of Siemens PLC sharing data over Ethernet with no extra wiring
  • Shared data laid out at fixed addresses so both CPUs read the same bytes the same way
  • Communication status checked so a lost link is seen, not silently ignored

Problem

A dairy plant ran part of its process on an older S7-300 and was adding equipment controlled by a newer S7-1200. The two controllers had to share data. Running extra hardwired signals between panels in a hygienic production area is slow and leaves no room to add more later.

My role & scope

I programmed the communication between the two PLCs with Siemens S7 PUT/GET and tested it on site with the plant team, in a production area with hygiene rules — hair nets, gowns and shoe covers on every visit.

Approach

S7-1200  ──GET──►  reads the S7-300's data block
         ──PUT──►  writes into the S7-300's data block
                      (S7 connection over Ethernet)

Use what both CPUs already speak

S7-300 and S7-1200 share S7 communication, so PUT and GET need no gateway and no extra licence. One PLC reads (GET) and writes (PUT) data areas in the other over the plant network.

Fixed addresses on both sides

The S7-300 works with absolute addresses, so the data exchanged is laid out in data blocks at fixed offsets, the same on both ends. A block that the partner reads cannot be an optimised block, and PUT/GET access has to be permitted in the S7-1200’s protection settings when it is the one being accessed.

Each PUT and GET returns done, error and status. The program watches those outputs, so a communication failure shows up as a fault instead of the machine quietly running on old values.

Delivery

  • Communication programmed and tested in TIA Portal
  • Tested on site with both controllers running in the plant
  • Handover of the updated programs

Result

  • The S7-1200 and the S7-300 exchange data over Ethernet with no added hardwired signals
  • New signals can be added by extending the data blocks instead of pulling new cables

Skills used

Siemens S7-1200 and S7-300 · TIA Portal V17 · S7 communication (PUT/GET) · data-block layout for absolute addressing · communication diagnostics · working in a hygienic food plant.

  • #PLC
  • #Integration
  • #Commissioning

Healthcare — hospital energy management

Hospital Energy Monitoring & Electricity Cost Calculation

Energy monitoring for a public hospital with rooftop solar — power-meter data in Siemens Energy Manager PRO, with dashboards of use per building and the electricity cost calculated from it.

Role
Energy monitoring set-up and electricity cost calculation
Company
P.A.M Engineering & Automation
Period
Jan 2024 – Dec 2024
Platforms
Siemens Energy Manager PRO · Siemens SENTRON PAC5200
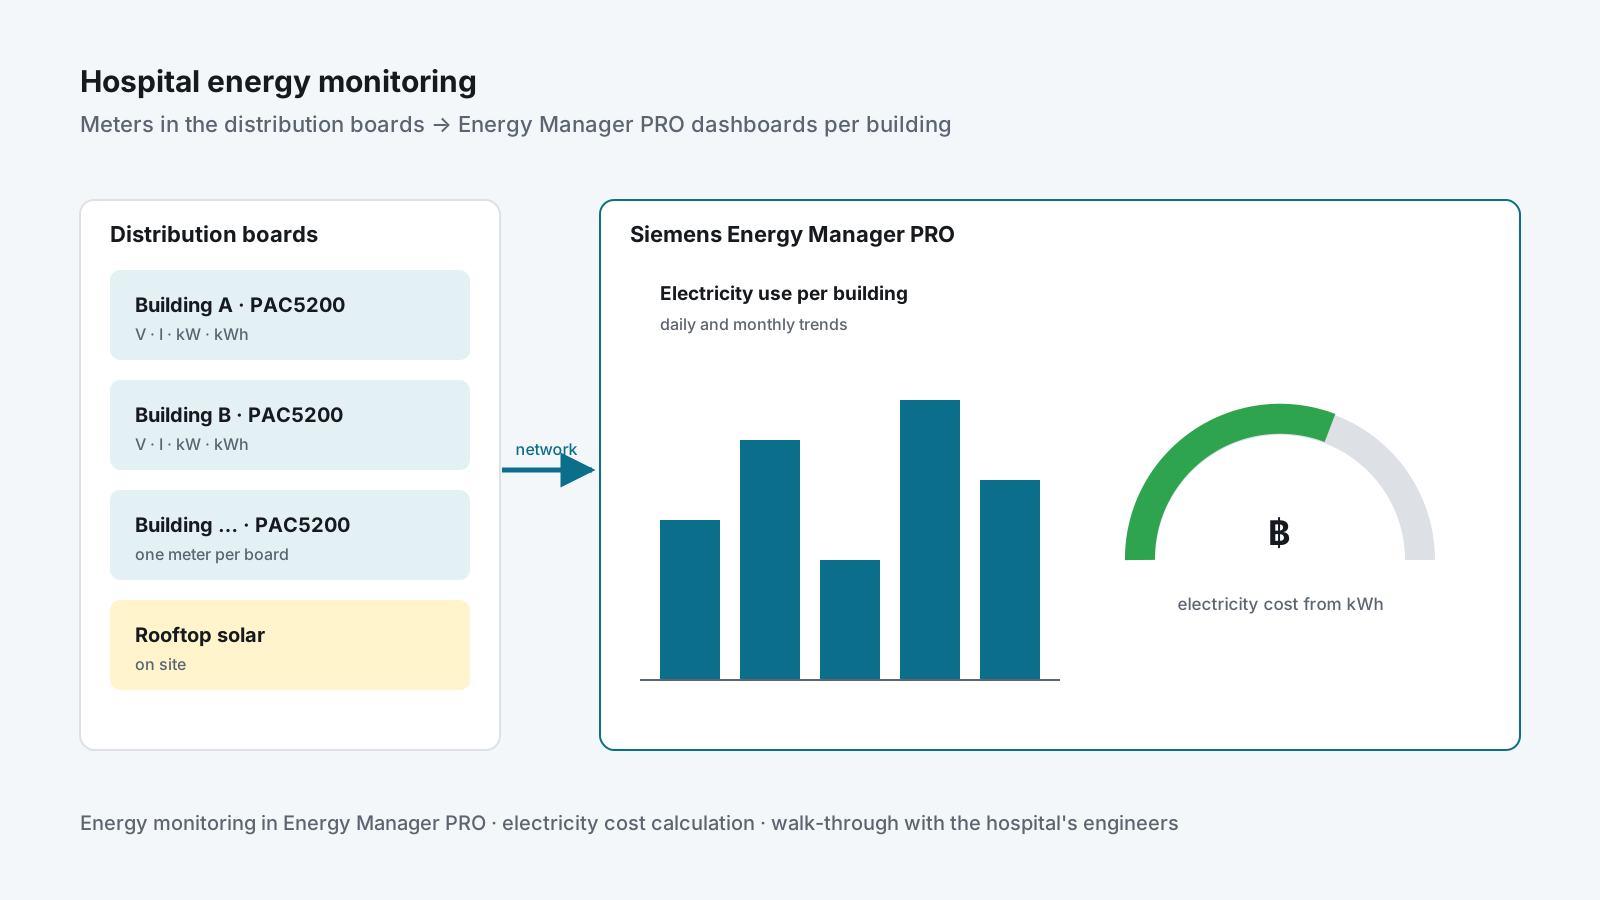
Power meters in the hospital's distribution boards reporting to Energy Manager PRO, which shows electricity use per building and its cost.

Highlights

  • Electricity use shown per building instead of one number on the utility bill
  • Electricity cost calculated from the measured energy, not estimated
  • Dashboards the hospital's facilities team can read without engineering software

Problem

A large public hospital, which was also installing rooftop solar, wanted to know where its electricity went and what it cost. The utility bill gave one figure for the whole site; nobody could say which building used what, or what that use was costing.

My role & scope

My part was the monitoring and the money: setting up energy monitoring in Siemens Energy Manager PRO from the SENTRON power meters in the distribution boards, and calculating the electricity cost from the measured energy.

Approach

Measured, not estimated

The PAC5200 meters in the distribution boards report voltage, current, power and energy for each building. Energy Manager PRO stores those readings and shows them as dashboards of use per building, with trends and gauges.

From kWh to baht

The energy readings are turned into an electricity cost, so the facilities team sees what each building’s use is costing, not only how many kilowatt-hours it took.

Delivery

  • Energy monitoring configured in Energy Manager PRO for the meters on site
  • Electricity cost calculation from the measured energy
  • Walk-through with the hospital’s engineers at handover

Result

  • Electricity use and cost visible per building instead of one monthly figure
  • A measured baseline for the hospital’s energy-saving work and its solar plant

Skills used

Siemens Energy Manager PRO · SENTRON power meters · energy monitoring and reporting · electricity cost calculation · working with a public client’s engineering team.

  • #Energy
  • #Data

Food processing — vegetable-oil plant, bulk material handling

Bulk-Bag Filling Line — PLC and HMI from Infeed to Outfeed

Wrote the PLC program and HMI myself for a big-bag filling line in a vegetable-oil plant — every machine from the start of the line to the end, with fill-by-weight and on-site commissioning.

Role
PLC and HMI programmer — the whole line, from infeed to outfeed, and commissioning on site
Company
P.A.M Engineering & Automation
Period
Jun 2024 – Sep 2024
Platforms
Siemens S7-1200 · TIA Portal V17 · Siemens HMI
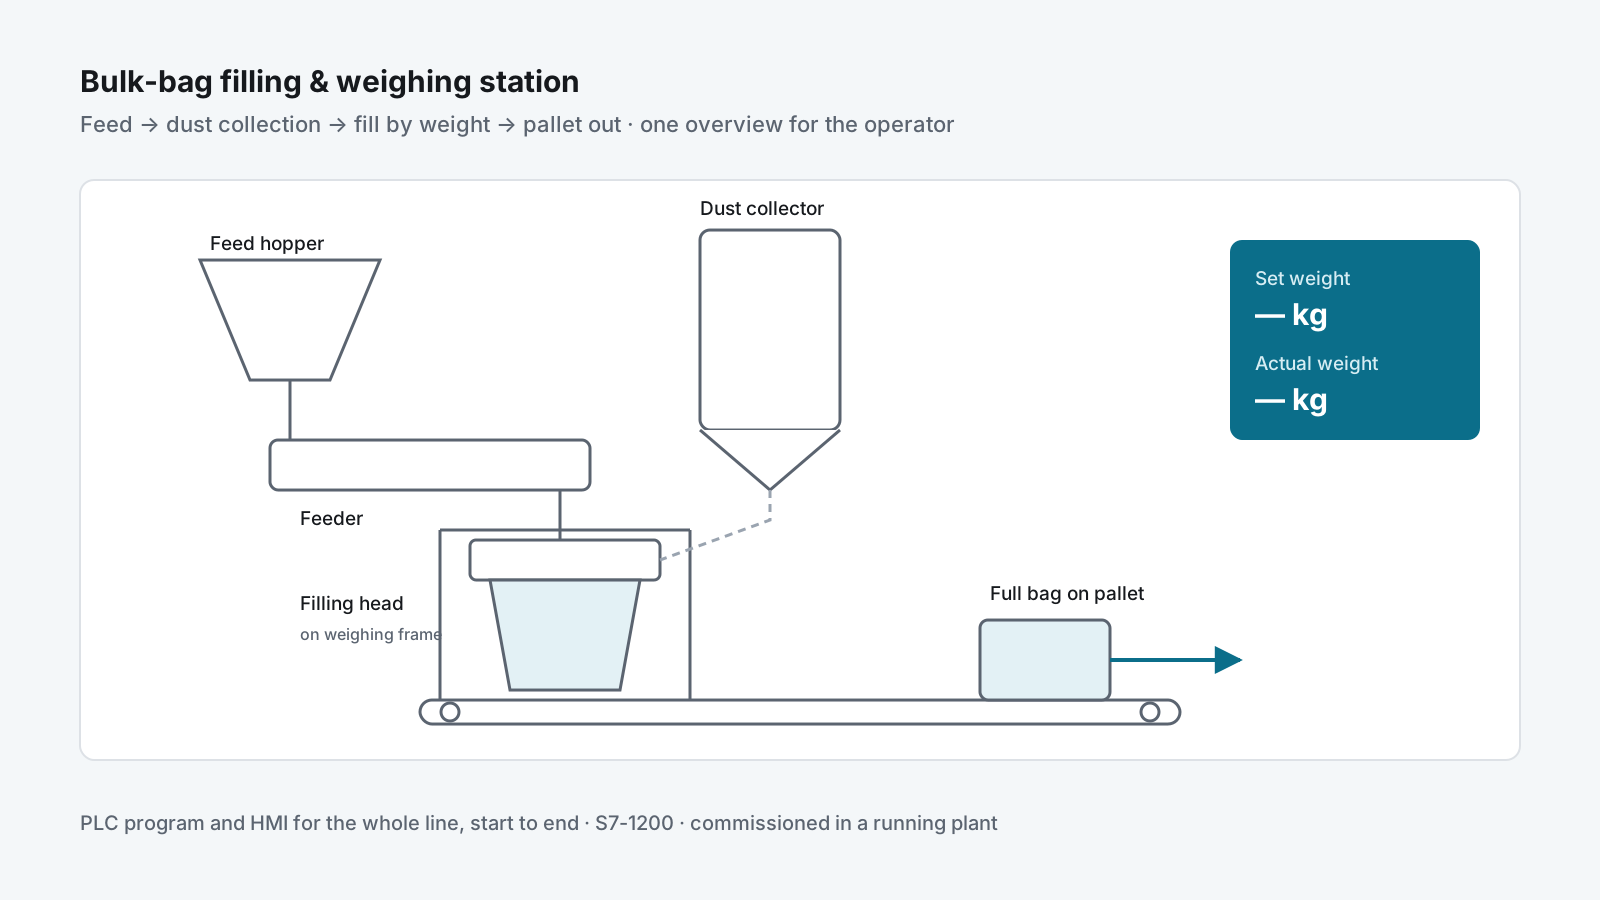
Process overview of the big-bag line — feed hopper, dust collector, filling head on a weighing frame, and the pallet conveyor out.

Highlights

  • PLC program and HMI written by me, covering every machine from the start of the line to the end
  • Fill-by-weight with setpoint and actual weight on the operator screen
  • One process overview for the whole line — feed, dust collection, filling and pallet conveyor
  • Commissioned in a running plant, including night work around production

Problem

A vegetable-oil plant was installing a big-bag filling line, supplied with weighing equipment from a specialist vendor. Material is fed from a hopper, filled into a bulk bag hanging on a weighing frame, and the full bag leaves on a pallet conveyor, with a dust collector on the filling head. Every machine on the line needed one control program and one operator screen, commissioned inside a plant that kept producing.

My role & scope

I wrote the PLC program and the HMI myself, for the whole line — from the infeed at the start to the pallet conveyor at the end — and commissioned them on site with the weighing-equipment supplier and the plant’s operators, including night shifts so testing did not stop production.

Approach

One program for the whole line

The line runs as one sequence: feed, fill, weigh, release the bag, move it out. The program covers every machine on it — feeder, dust collector, filling head, conveyor — and the sequence that runs them in order, so the plant has one place to look when the line stops.

Fill by weight

The operator enters a set weight for the bag. The screen shows setpoint and actual weight side by side while the bag fills, and the sequence stops the feed when the target is reached.

One screen for the whole line

The HMI shows a process overview of the full line with each motor and valve in its running or stopped state, so the operator sees where a bag is and why it is waiting.

Delivery

  • I/O check of every device against the drawings
  • Each machine tested on its own, then the full sequence — first empty, then with product
  • Commissioning on site with the supplier and the plant’s operators
  • Handover of the PLC and HMI program backups

Result

  • The line runs from infeed to outfeed on one program and one operator screen that I wrote
  • Bags filled to a set weight, with setpoint and actual weight visible to the operator
  • Commissioned without stopping the rest of the plant

Skills used

Siemens S7-1200 and TIA Portal V17 · Siemens HMI screen design · machine sequences and interlocks · weighing and batching · material handling and dust collection · commissioning in a live food plant.

  • #PLC
  • #HMI
  • #Commissioning

Brewery — keg conveying and filling line

Keg Line Control Upgrade — S7-300 to S7-1500 Retrofit

Replaced the ageing control cabinets of a brewery keg line — S7-300 and Pro-face panels to S7-1500, Comfort panels, safety relays and new drives — on a running plant, from bid to handover.

Role
Project engineer — revised the PLC program and built the HMI screens for conveyor control and the line
Company
P.A.M Engineering & Automation
Period
Sep 2023 – Jul 2024
Platforms
Siemens S7-1500 · TIA Portal V17 · SIMATIC Comfort Panels · Pilz PNOZ s4 · Danfoss FC 302 · PROFINET · PROFIBUS
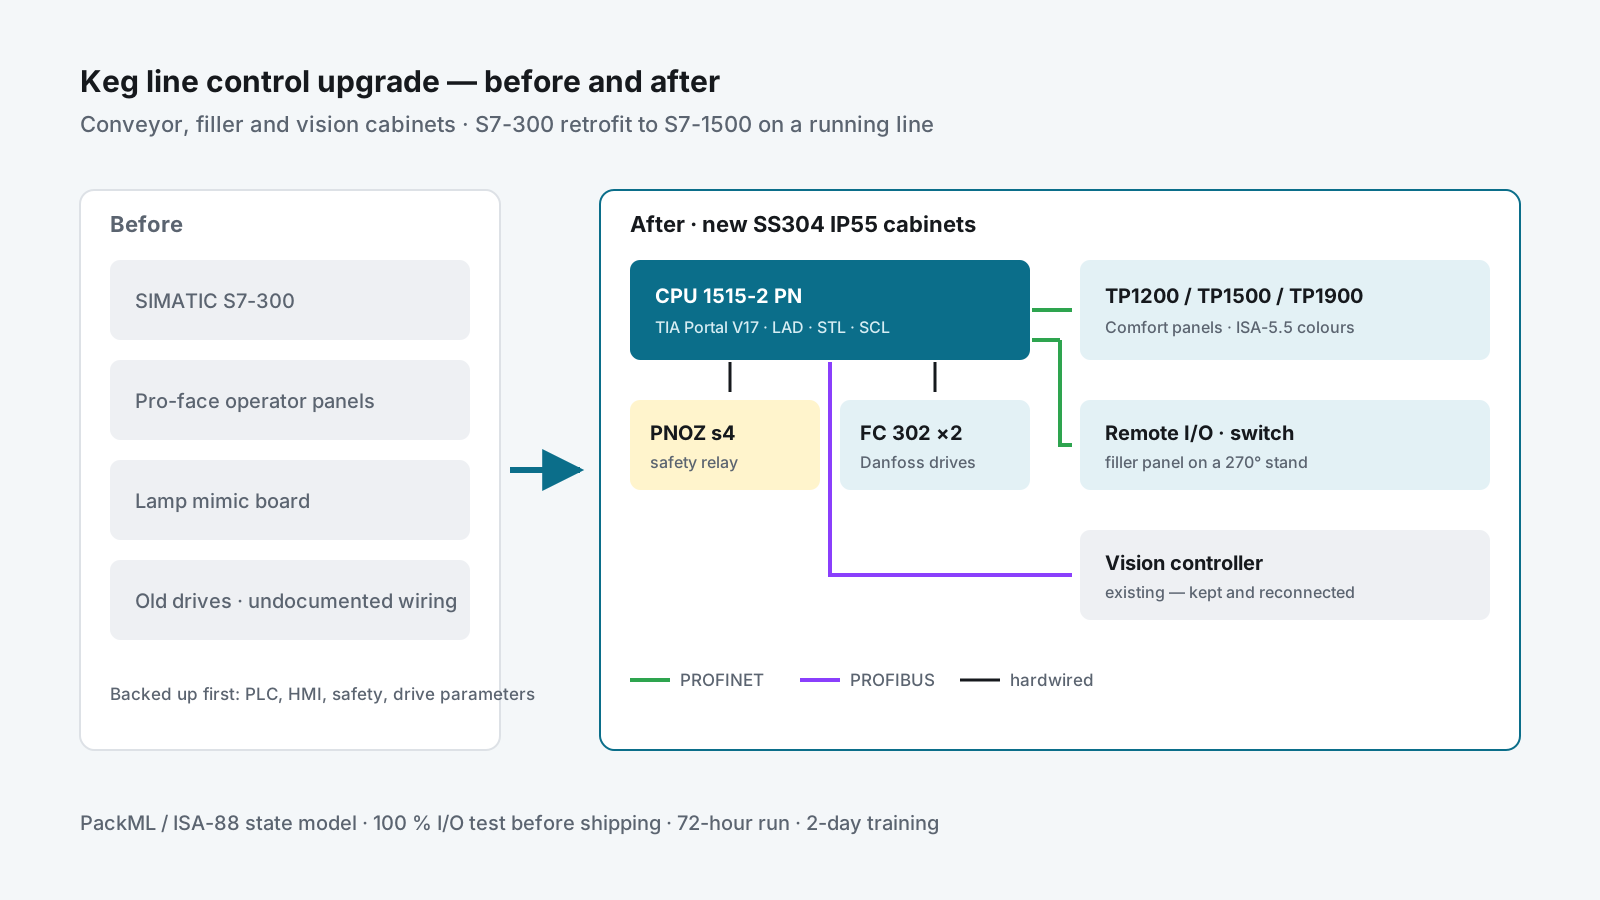
Before-and-after of the retrofit — S7-300 and Pro-face panels replaced by an S7-1500 cabinet with a Comfort panel, safety relay and two drives, linked to the vision controller.

Highlights

  • Three cabinets rebuilt — conveyor, filler and vision — in 2 mm SS304, IP55
  • S7-300 and Pro-face replaced by S7-1500 and Comfort panels, rewired cable by cable
  • Program structured on the PackML / ISA-88 state model; HMI colours to ISA-5.5
  • 100 % I/O and function test before shipping, then a 72-hour continuous run on site

Problem

A brewery’s keg line was still controlled from its original cabinets: an S7-300 PLC, Pro-face operator panels, a mimic board of indicator lamps and years of added wiring. Spare parts were getting hard to find, faults took long to trace through undocumented cables, and the line could not be stopped for long — it fills the kegs the plant ships.

The plant wanted the conveyor and filler controls replaced with current Siemens hardware, without losing a single machine function or any of the line’s original output.

My role & scope

Project engineer in the integrator’s team, from the bid in September 2023 to handover in July 2024. My own part was the software:

  • Revised the PLC program for the new S7-1500 — carried over from the S7-300 into the client’s module structure, without changing how the machines behave
  • Built the HMI screens for conveyor control and the keg line on the new Comfort panels, including the status that used to be on the lamp mimic board
  • Took part in the I/O test and commissioning of my screens and logic on site

The team covered the rest of the scope: site survey, backups, electrical drawings, the cabinet build, installation and training. Three cabinets were replaced — the conveyor control cabinet, the Filler 1 control cabinet with a separate operator panel and junction boxes, and the vision cabinet.

Approach

Before                                   After
S7-300 + Pro-face panel          ──►     CPU 1515-2 PN + TP1200 / TP1500 Comfort
Lamp mimic board                 ──►     Status moved onto a TP1900 Comfort screen
Old drives and safety wiring     ──►     Danfoss FC 302 drives + Pilz PNOZ s4 safety relay
                                         PROFINET to panels and remote I/O · PROFIBUS to the vision controller

Start from what the line really does

Before any logic changed, the team surveyed the running line: every sensor, motor and cable, and each machine sequence written down as a flowchart. The old PLC, HMI and safety programs and the drive parameters were backed up first. Those flowcharts and backups were what I checked the revised program against.

Keep the program structure the client knows

The client’s rule was that the new program must keep the structure of the old one; anything added must not disturb it. The PLC program is organised in device modules — general, HMI, safety, drives and servos, infeed, outfeed, interface — each with its data, logic and functions, and a machine state model based on OMAC PackML and ISA-88. Ladder, STL and SCL are used where each fits.

An HMI specification before the screens

The screens were specified before they were drawn: 1280 × 800 layout with a title bar, status bar, work area, navigation and machine functions; status colours following ISA-5.5 (green running, grey stopped, red and blinking for an alarm); message classes for critical errors, errors, warnings and information; and logs for parameters, alarms and trends. The lamp mimic board was removed and its information moved onto the HMI. The client approved the design before installation.

Build it to last in a wet plant

New cabinets in 2 mm stainless steel 304, IP55, with air conditioning. The filler panel is on a stand that turns through 270° so the operator can see it from the machine. All wiring follows one colour code: three phases, neutral, earth, 230 V, 24 V control and measuring leads.

Delivery

  • Sep–Nov 2023: bid, site survey, purchase order, material and shop drawings, purchasing
  • Nov 2023 – Jul 2024: cabinet build, 100 % I/O and function test before the cabinets left the workshop, removal of the old cabinets and cables, installation, rewiring and commissioning
  • Acceptance: the line had to reach its original performance and run for 72 hours without interruption, with any defect fixed to the client’s satisfaction
  • Handover (Jul 2024): as-built drawings, source code and backups, manuals, labelling, and two days of operation and maintenance training

Result

  • Keg line running on supported hardware, with spare parts and drawings that match the plant
  • Faults traced on the HMI instead of on a lamp board and through untraceable wiring
  • A program in the client’s own structure, so their engineers can maintain it
  • Accepted after a 72-hour run at the line’s original performance

Skills used

Siemens S7-1500 and TIA Portal V17 (LAD, STL, SCL) · SIMATIC Comfort panels · PLC migration from S7-300 · PackML / ISA-88 state model · ISA-5.5 HMI colours · Pilz safety relays · Danfoss drives · PROFINET and PROFIBUS · keeping a client’s program structure while changing the hardware under it · I/O test and commissioning on a running line.

  • #PLC
  • #HMI
  • #Retrofit
  • #Commissioning

Engineering education — process control laboratory

Process Control Cloud Lab — Simulink to InfluxDB & Grafana on AWS

A VPN-only AWS server where every student's Simulink run lands in InfluxDB and Grafana, with Single-loop, Cascade and MPC models that switch between simulation and the real rig.

Role
Platform builder — cloud server, data pipeline, student access, Simulink models, dashboards and runbooks
Company
Pranakorn Energy (part-time)
Period
Jun 2026 – Present
Platforms
AWS EC2 · Tailscale · InfluxDB · Grafana · MATLAB / Simulink · PostgreSQL · Docker Compose · Siemens S7-1500
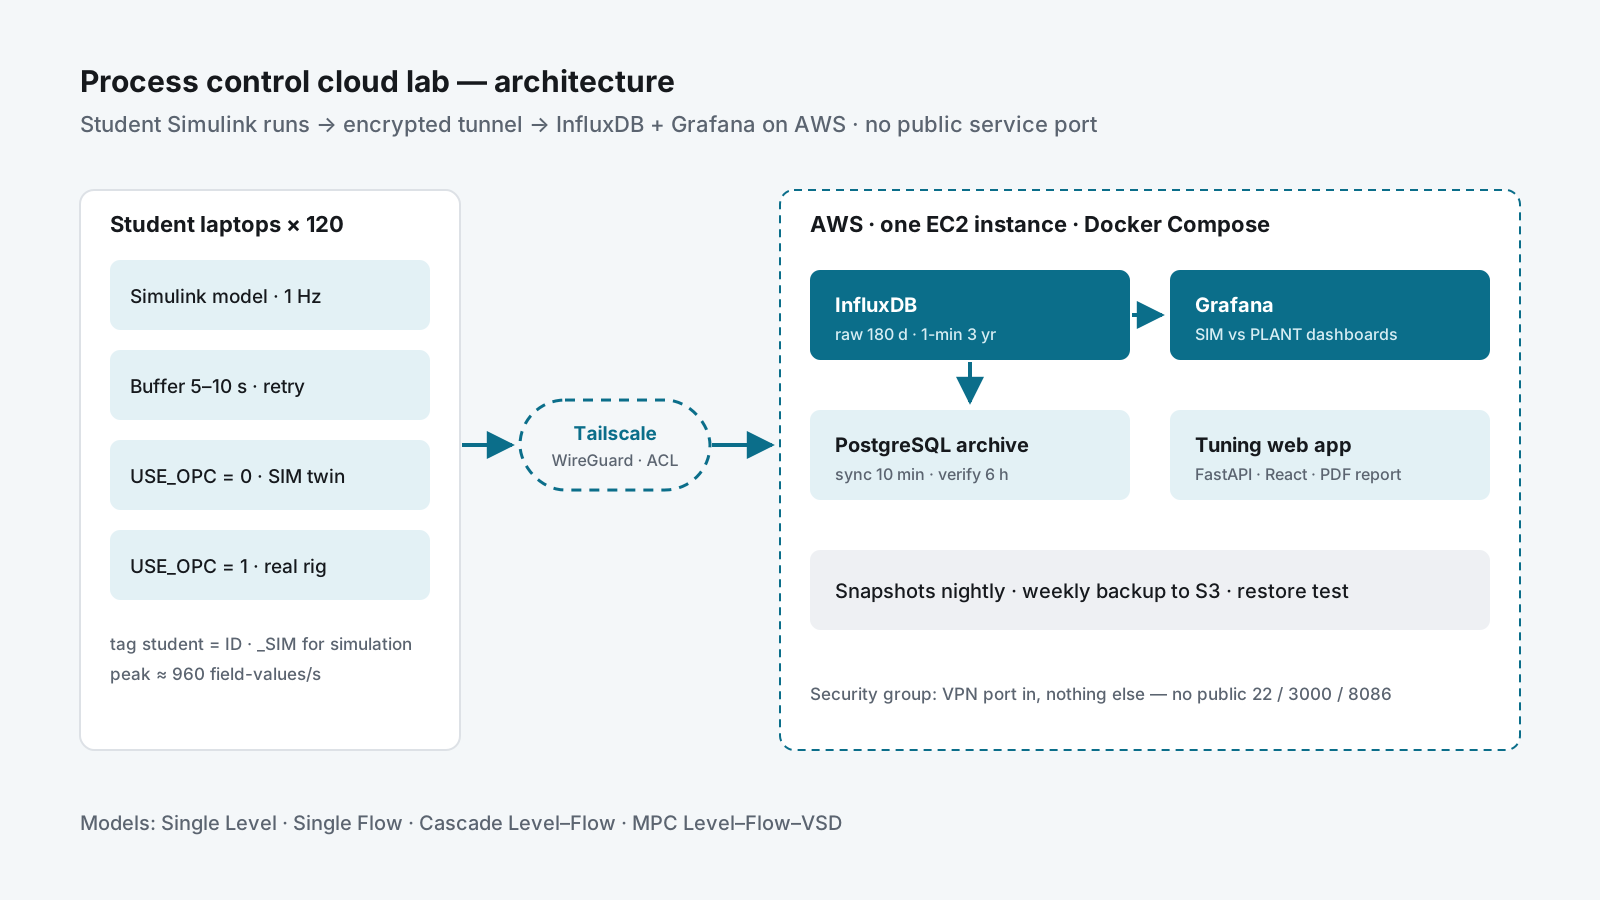
Architecture of the cloud lab — student Simulink models stream through a Tailscale tunnel into InfluxDB and Grafana on one AWS server, with a PostgreSQL archive and S3 backups.

Highlights

  • Sized for 120 students writing at 1 Hz — about 2 % of what InfluxDB handles on the chosen host
  • No service port open to the internet — InfluxDB, Grafana and SSH are reachable only through the VPN
  • Four Simulink models (Single Level, Single Flow, Cascade, MPC) with one switch between simulation and the real rig
  • Every point copied to a PostgreSQL archive by a sync that is safe to re-run, checked every 6 hours

Problem

In a university process-dynamics course, students run PID and MPC models in Simulink on their own laptops. The results stayed on those laptops: the instructor could not see a run unless it was screenshotted, two students’ tunings could not be compared, and nothing survived the end of the lab session.

The course also has one real rig — a pump, level and flow loop on a Siemens S7-1500 — that students could only reach from inside the lab. The goal was a central place for every run, simulated or real, without exposing the lab PLC or any server to the internet, on a university budget.

My role & scope

I built the platform and wrote the documentation for it, working with the professor who runs the course:

  • Pilot server on AWS, then the sizing and cost plan for the full class
  • The MATLAB/Simulink write path into InfluxDB
  • Student access: VPN keys, access rules, device naming and the pilot test
  • Grafana dashboards, the PostgreSQL archive and the backup scripts
  • Phase 2 Simulink models (Single Level, Single Flow, Cascade, MPC) and their test plan
  • Runbooks in English and Thai, and a teaching deck for the class

Scale: 120 students planned, 5 pilot testers, 4 control models, 4 dashboards plus a comparison view.

Approach

Student laptop × 120                 AWS (one EC2 instance, Docker Compose)
Simulink model ──1 Hz──► buffer 5–10 s ──► Tailscale tunnel ──► InfluxDB ──► Grafana
       │                                     (WireGuard)            │
       └── USE_OPC = 1 ──► OPC UA ──► S7-1500 rig                   ├──► PostgreSQL archive (every 10 min)
                                                                     └──► S3 backup + volume snapshots

Zero public surface

The security group lets in one UDP port for the VPN and nothing else. InfluxDB, Grafana and SSH listen only on the tunnel interface. Students, instructors and admins are separated by tags in the VPN access rules: students can write data and view dashboards; instructors can build dashboards; only two admins can log in to the server.

A MATLAB helper buffers 5–10 seconds of samples and sends them as one InfluxDB line-protocol request, with retries and exponential backoff. Buffering cuts the load at peak from 120 HTTP requests a second to 24. Every point carries a student tag, so one bucket holds the whole class and each dashboard can be filtered to one person.

Student access to the real PLC

The PLC sits behind a small Linux box in the lab that routes the lab subnet into the VPN. The access rule for students opens the PLC’s single address only, not the whole lab network, and it is a separate rule so it can be deleted at the end of term. Each student joins with their student ID as the device name — otherwise 120 machines show up as DESKTOP-xxxx with no owner. The rule was tested from a machine that had never joined the network: the admin’s own laptop passes every test and proves nothing.

One model, simulation or plant

Each Simulink model has a USE_OPC switch: 0 runs against the plant model, 1 reads and writes the real PLC over OPC UA. Both modes log to the same measurement with a _SIM suffix on the student tag, so a dashboard puts the simulated and the real response of the same controller side by side. The Single-loop and Cascade dashboards are generated by a script from the MPC dashboard, so all three look and behave the same.

Sizing before spending

The pilot ran on a small instance; the plan for the full class is a 4 vCPU / 16 GB Graviton instance in the Bangkok region, upgraded in place because both are arm64. The recommendation is on-demand for the first semester, then a savings plan sized from measured load. The plan also flagged a VPN licensing trap before it happened: with per-seat pricing, 120 student devices could cost more than seven times the server.

Data you can trust

InfluxDB keeps raw data for 180 days and a 1-minute downsample for three years. A Python job copies every point into PostgreSQL with (student, time) as the primary key, so running the copy twice updates rows instead of duplicating them; fields it does not know yet go into a JSON column instead of being dropped. A second job compares both sides every six hours. Nightly volume snapshots and a weekly InfluxDB backup to S3 come with a restore-test script.

Delivery

  • Phase 0 (June–July 2026): pilot server with InfluxDB and Grafana behind the VPN; Simulink to InfluxDB verified end to end; 14-slide teaching deck and workflow diagram; key-generation script, access rules and a self-service portal prototype; pilot test with 5 users.
  • Phase 1 plan (August 2026): architecture, cost comparison and setup runbooks for the full class.
  • Phase 2 (October 2026): four models rebuilt to one pattern; a test gate before any model touches the rig — compile in both modes, switch modes with the model open, a 3,000-second simulation run and tuning metrics; one site day on the rig per model; handover package of models, dashboard files, archive scripts and a bilingual test report.
  • A companion web app (FastAPI + React) for the same data: fits a first-order-plus-dead-time model to a step response and gives Ziegler-Nichols, Cohen-Coon and IMC tunings with a PDF report per student.

Result

  • One place for every student run, simulated or real, instead of screenshots
  • Students compare the simulated and the real response of their own controller in one dashboard
  • The lab PLC reachable for class work without opening the lab network to the internet
  • A costed, documented plan the department can approve and the next admin can rebuild from

Skills used

AWS (EC2, EBS snapshots, S3, IAM, CloudWatch, Budgets) · Tailscale VPN, subnet routing and access rules · InfluxDB 2 and Flux · Grafana dashboards as code · PostgreSQL · Docker Compose · MATLAB / Simulink with OPC UA · PID, cascade and MPC loops · Python · FastAPI and React · writing runbooks in English and Thai.

  • #Cloud
  • #Data
  • #Process control
  • #OPC UA
  • #Education

Engineering education — process control training rig

Digital Twin Training Rig — S7-1500 and Simulink over OPC UA

A pump, level and flow rig whose PLC talks to a Simulink twin over OPC UA, so students tune single-loop and cascade PID in simulation and then run the same controller on real hardware.

Role
Simulink and OPC UA integration — plant models, PID and cascade loops, tuning sessions, teaching material
Company
Pranakorn Energy (part-time)
Period
May 2025 – Jun 2026
Platforms
Siemens S7-1500 · TIA Portal V17 · MATLAB / Simulink · OPC UA · Industrial Communication Toolbox
Level-flow cascade on the training rig — the level controller sets the flow setpoint, the flow controller drives the control valve, and Simulink reads and writes the PLC over OPC UA.

Highlights

  • The same Simulink controller runs against the plant model or the real rig — one switch
  • Level–flow cascade (level PI → flow PI → control valve) on a pump loop with a VSD
  • Material for weeks 9–15 of a process-control course — labs, pre- and post-tests, videos
  • The rig later became the plant for the cloud lab every student connects to

Problem

Process-control students meet PID in two places that never touch: on paper, and in a simulator where the plant behaves perfectly. The one real rig in the lab is slow to set up, shared by the whole class, and a bad tuning can overflow a tank.

The course needed a bridge — a model of the rig that behaves like the rig, connected to the rig’s own PLC, so a controller designed in Simulink can be tried safely and then run for real without being rewritten.

My role & scope

I built the Simulink side and the link to the PLC, working with the professor and the PLC programmer on the rig:

  • Plant models of the level and flow loops
  • PID and cascade controllers in Simulink, and the MATLAB functions that read and write the PLC
  • The tag contract with the PLC program: setpoint, process value and output for each loop
  • Tuning sessions on the rig, recorded as teaching videos
  • Course material for the control-loop weeks

The rig: one pump loop with a level transmitter, a flow transmitter, a control valve and a pump on a variable-speed drive, controlled by an S7-1500 programmed in TIA Portal V17.

Approach

Simulink                                      S7-1500 (OPC UA server, port 4840)
Level PI ──SP_flow──► Flow PI ──MV──┐
   ▲                     ▲          │  USE_OPC = 0 → plant model in Simulink
   │                     │          └► USE_OPC = 1 → write MV, read PV over OPC UA
   └──── PV_level ◄──────┴── PV_flow ◄──────────────── LT-101 · FT-101 · FCV-101

Model the plant before tuning it

The level loop is modelled as an integrating process, G(s) = K/s; the flow loop as first order plus dead time, G(s) = K·e^(−θs)/(τs + 1). Parameters come from step tests on the rig, so the model’s gain, time constant and dead time are measured, not guessed. That is what lets a tuning found in simulation carry over to the hardware.

OPC UA instead of a second PLC program

The S7-1500 has an OPC UA server built in. MATLAB’s Industrial Communication Toolbox connects to it, browses the address space and reads and writes the loop tags by their symbolic names. The rig needs no extra hardware or licence to talk to Simulink, and the same tag names work in every model.

Cascade, then compare

The outer level controller sets the setpoint of the inner flow controller, which drives the control valve. The inner loop is tuned first and made faster than the outer one. Students then run the single-loop and cascade versions against the same disturbance and compare the responses.

One client or a whole class

Two ways to expose the PLC were compared. Serving OPC UA straight from the PLC gives the lowest latency and needs no licence, but every client adds load to the PLC cycle and needs network access to it. An industrial PC as a gateway keeps the PLC isolated and its load constant, at the cost of extra latency and a server licence. Direct access suits a lab bench with one or two clients; more clients call for the gateway or for tight network rules — the second route was taken in the cloud lab.

Delivery

  • Simulink models revised through many versions as the PLC program evolved across 2025 and 2026
  • Tuning sessions for level and flow on the rig, recorded for students (February 2026)
  • Course plan for weeks 9–15: instrumentation and P&ID symbols, PLC architecture and start-up and shutdown sequences, basic loops and trial-and-error tuning, pump curves in open loop, closed-loop tuning, cascade control, and a capstone — each week with a pre-test, a post-test and a video
  • A teaching chapter on level–flow cascade control, with the P&ID, faceplates and worked error and controller-output examples

Result

  • Students tune in simulation first, then run the same controller on the real rig
  • Experiments that used to take a lab session to set up can be repeated from a laptop
  • One rig serves a whole class, because most of the work happens on its twin
  • The models and the tag contract became the basis of the cloud lab used in 2026

Skills used

Process modelling (integrating and FOPDT processes) · PID and cascade tuning · MATLAB / Simulink · OPC UA (S7-1500 server, MATLAB client) · Siemens TIA Portal V17 · reading P&IDs · teaching control theory with real hardware.

  • #Process control
  • #Digital twin
  • #OPC UA
  • #PLC
  • #Education

Engineering education — online course

Industrial Automation Online Course — MATLAB/Simulink to PLC over OPC UA

A video course that takes engineers from a first Simulink model to tuning a real S7-1500 loop over OPC UA — 6 sections, 29 lessons, hands-on labs and two final projects.

Role
Course author and presenter — outline, slides, lab files and recorded lessons
Company
Pranakorn Energy (part-time)
Period
Jan 2026 – May 2026
Platforms
MATLAB / Simulink · Siemens TIA Portal V17 · S7-1500 · PLCSIM Advanced · OPC UA · UaExpert
The six sections of the course as a path — Simulink fundamentals, PID design, TIA Portal, OPC UA, hardware-in-the-loop and final projects.

Highlights

  • 6 sections and 29 lessons, from a first Simulink model to hardware-in-the-loop
  • Every lesson marked as Theory, Demo, Lab or Project
  • One level loop and one flow loop followed from model to PLC
  • 12 recorded videos and 15 lesson handouts so far

Problem

Automation engineers know PLCs but rarely design a controller; control students know Simulink but have never configured a PLC. Courses teach the two separately, and the bridge between them — OPC UA, scaling, hardware-in-the-loop — is exactly where real commissioning goes wrong.

My role & scope

I wrote the course outline, the slides and lesson handouts, built the Simulink and TIA Portal files students use, and recorded the lessons. The outline was prepared as a proposal for an online learning platform.

Approach

Section Lessons Focus
1 · MATLAB & Simulink fundamentals 6 Plant modelling, solvers, first workshop
2 · PID controller design 7 Tuning methods, level and flow loops
3 · Siemens TIA Portal V17 6 S7-1500, PID_Compact, 4–20 mA scaling
4 · OPC UA communication 6 Server on the PLC, MATLAB and Simulink client
5 · Hardware-in-the-loop 4 Co-simulation, performance analysis
6 · Final projects 3 Level and flow — full workflow and report

One plant from start to finish

The course follows the same two loops all the way through: a tank level (an integrating process) and a flow loop (first order plus dead time). Students model them in Section 1, tune them in Section 2, program them in Section 3, connect them in Section 4 and run them against hardware in Section 5. Nothing is a toy example that disappears after one lesson.

Simulation before hardware

Each step adds one real thing. Students tune in Simulink with the PID Tuner, then run PID_Compact on PLCSIM Advanced, then enable the S7-1500’s OPC UA server and check it with UaExpert, then link Simulink to the PLC. Scaling a 4–20 mA signal (raw 0–27648 to engineering units) gets its own lesson, because that is where models and PLCs disagree.

Say what kind of lesson it is

Every lesson is labelled: Theory (concepts on slides), Demo (follow along with the software), Lab (step-by-step on your own) or Project (the full workflow). Learners know before they press play whether they should be watching or doing.

Delivery

  • Course outline: 6 sections, 29 lessons, objectives and key content for each
  • Lesson handouts for Sections 1–5 and Simulink workshop files
  • 12 recorded lessons (February–May 2026), including OPC UA server setup on the S7-1500, an OPC UA block in Simulink, and running a flow loop with a PI controller from Simulink

Result

  • A path from “never opened Simulink” to tuning a real PLC loop, in one course
  • Lessons reusable in the university course and on the training rig
  • Material that shows how I explain control and integration to engineers

Skills used

Course design · MATLAB / Simulink and the PID Tuner · Siemens TIA Portal V17, S7-1500, PID_Compact and PLCSIM Advanced · OPC UA · hardware-in-the-loop testing · video lessons and lab handouts.

  • #Education
  • #Process control
  • #OPC UA
  • #PLC

Engineering education — vending and payment automation trainer

QR-Payment Vending Trainer — PLC, HMI and IoT Gateway

A training unit that turns a coin-operated washing machine into a QR-payment machine — FX5U PLC, GOT2000 HMI, IoT2050 MQTT gateway and a web payment front end — with FAT/SAT and a course.

Role
Controls lead — bill of materials, electrical drawings, PLC and HMI program, training lessons
Company
Pranakorn Energy (part-time)
Period
Jan 2025 – Dec 2025
Platforms
Mitsubishi FX5U · GX Works3 · GOT2000 · Siemens IoT2050 · Node-RED · MQTT · Flutter · Node.js · Omise / PromptPay
Block diagram of the trainer — coin acceptor and machine I/O on an FX5U PLC with a GOT2000 HMI, an IoT2050 gateway publishing MQTT, and a payment front end.

Highlights

  • One trainer covers the whole chain — machine I/O, PLC, HMI, IoT gateway, payment and notifications
  • 50-item bill of materials, wiring and single-line drawings, and an energy-monitoring panel
  • Accepted against a FAT/SAT protocol — power, software, backup, communication and diagnostics checks
  • Turned into a 3-day hands-on course and an online PLC course

Problem

Students learn PLCs on boards of lamps and switches. Real machines on the street now take QR payments, report online and send alerts — and none of that is on the lamp board.

The university wanted a trainer built around a real machine: a coin-operated washing machine that also accepts QR payments, so students can follow one payment from the phone to the motor.

My role & scope

I led the controls side of a small team:

  • Bill of materials and the datasheet for every device
  • Electrical drawings: wiring diagram, single-line diagram and the energy-monitoring panel
  • Automation architecture
  • FX5U PLC program and GOT2000 HMI screens, step-function flowchart and I/O tests
  • Lessons for the course: PLC basics (I/O and data types), basic commands, and GOT2000 screen design

Teammates built the 3D layout and the payment front end. The trainer is a mobile aluminium frame holding the machine, the control panel and the payment hardware.

Approach

Coin acceptor · buttons · motor ──► FX5U PLC ◄──► GOT2000 HMI
                                       │
                                  IoT2050 (Node-RED) ──MQTT──► payment front end · notifications
                                       │
Power meter · CT · temperature ────────┘

Hardware that matches a real machine

24 V DC control power, with a step-down to 12 V for the coin acceptor and the pulse generator. A brushless DC motor on a DC drive turns the drum. A UPS, tower lamp, emergency stop and reset button, and a managed switch complete the panel. A power meter, a 30/5 A current transformer and a temperature transmitter add energy monitoring, so the trainer also teaches metering.

The PLC owns the machine

The FX5U ladder program handles coin counting, the wash and spin sequence, machine status and the emergency stop. The GOT2000 HMI shows the coin count, the wash process and alarm events. The payment side sits beside the PLC and talks to it through the gateway, so the machine logic can be taught on its own before payment is added.

Gateway and notifications

The IoT2050 runs Node-RED: it reads the PLC and publishes over MQTT to the payment front end on a Raspberry Pi 5. The front end is a Flutter web app that also shows the machine’s status; payments go through Opn Payments / Omise with PromptPay QR, and a Node.js back end receives the payment webhooks over a REST API and passes the result on, with data stored over MQTT. Machine alerts went to a chat service; when LINE Notify was shut down, the notification flow moved to Discord.

Delivery

  • FAT/SAT protocol covering each power supply and device, software installation, PLC and HMI backups, PLC–HMI communication, program download and diagnostics
  • User manual for the training unit
  • 3-day course: payment concepts, architecture, safety and maintenance (day 1); PLC programming in GX Works3 and HMI screens in GT Designer (day 2); full integration and a live payment test (day 3)
  • Online course “PLC Basics for Washing Machine Automation” — 10 lessons from wiring to a Node-RED-linked HMI, recorded September–November 2025

Result

  • A trainer students can follow from QR scan to motor, instead of a lamp board
  • The same machine teaches PLC, HMI, IoT gateways, payment and energy metering
  • Documentation that lets the lab maintain it: drawings, BOM, FAT/SAT, manual and videos

Skills used

Mitsubishi FX5U and GX Works3 · GOT2000 and GT Designer3 · Siemens IoT2050 · Node-RED and MQTT · electrical design (wiring and single-line diagrams, panel layout) · BOM and datasheets · FAT/SAT · writing and teaching hands-on PLC lessons.

  • #PLC
  • #HMI
  • #IoT
  • #Education

Engineering education — PLC and process-control training

University PLC & Process-Control Training Courses

Six hands-on training courses for engineering students — PLC ladder, TIA Portal V17, KTP700 HMI, process pressure control, modern manufacturing and cloud IoT — on S7-1200 trainer kits and a pressure-process rig.

Role
Training engineer — trainer kits, course material and hands-on sessions
Company
P.A.M Engineering & Automation
Period
Aug 2023 – Sep 2023
Platforms
Siemens S7-1200 · TIA Portal V17 · SIMATIC KTP700 · Node-RED · MQTT
The six training courses arranged as a path from PLC ladder to cloud IoT, around an S7-1200 trainer kit and a pressure-process rig.

Highlights

  • Six courses in one programme — from ladder logic to cloud IoT
  • Every student on a real S7-1200 trainer with a KTP700 panel
  • Pressure-control loop taught on a real process rig, not only in software

Problem

Engineering students reach their final year knowing control theory but having never configured a PLC, drawn an HMI screen or tuned a loop on real equipment. The university wanted short, hands-on courses that would close that gap before they started work.

My role & scope

I worked on the courses while at the system integrator: preparing the trainer kits, the course material and the hands-on exercises, and helping run the sessions in the lab.

Six courses:

  1. PLC ladder programming
  2. Siemens TIA Portal V17
  3. HMI with the SIMATIC KTP700
  4. Process pressure control
  5. Modern manufacturing skills
  6. Cloud IoT

Approach

Hardware for every student

Each student works on a bench trainer — an S7-1200 PLC with a KTP700 panel, push buttons and lamps — so every exercise ends with something that actually switches.

A real loop for process control

The pressure-control course runs on a process rig with an air supply, a control valve, a pressure transmitter and a PID controller in the PLC. Students see what a badly tuned loop does to a real pressure, not just to a simulated curve.

Finish with data leaving the PLC

The last course takes PLC data to the cloud, so students see the whole chain from a sensor to a dashboard.

Delivery

  • Trainer kits and the pressure rig prepared and tested before each course
  • Course material and exercises for each of the six topics
  • Hands-on sessions in the university’s automation lab

Result

  • Students configured PLCs, built HMI screens and tuned a loop on real hardware
  • A course set the university could run again with the same kits
  • The start of the education work that continued in 2025 and 2026

Skills used

Siemens S7-1200, TIA Portal V17 and KTP700 · ladder logic · PID pressure control · IoT gateways and cloud dashboards · preparing hands-on training.

  • #Education
  • #PLC
  • #HMI
  • #Process control

Process control research — pressure loop

B.Eng. Thesis — MPC-Based PID Control of a Pressure Process (Phase I)

Identified a real pressure loop from ten step tests on an S7-1200 rig, tuned PID_Compact from the fitted model, and showed why one fixed PID cannot cover the whole operating range.

Role
Thesis team of three — step tests, process model and PID tuning on the rig
Company
KMUTNB — B.Eng. thesis
Period
Jun 2022 – Mar 2023
Platforms
Siemens S7-1200 · TIA Portal V17 (PID_Compact) · WinCC Unified Comfort Panel · SIMATIC IoT2050 · Factory I/O
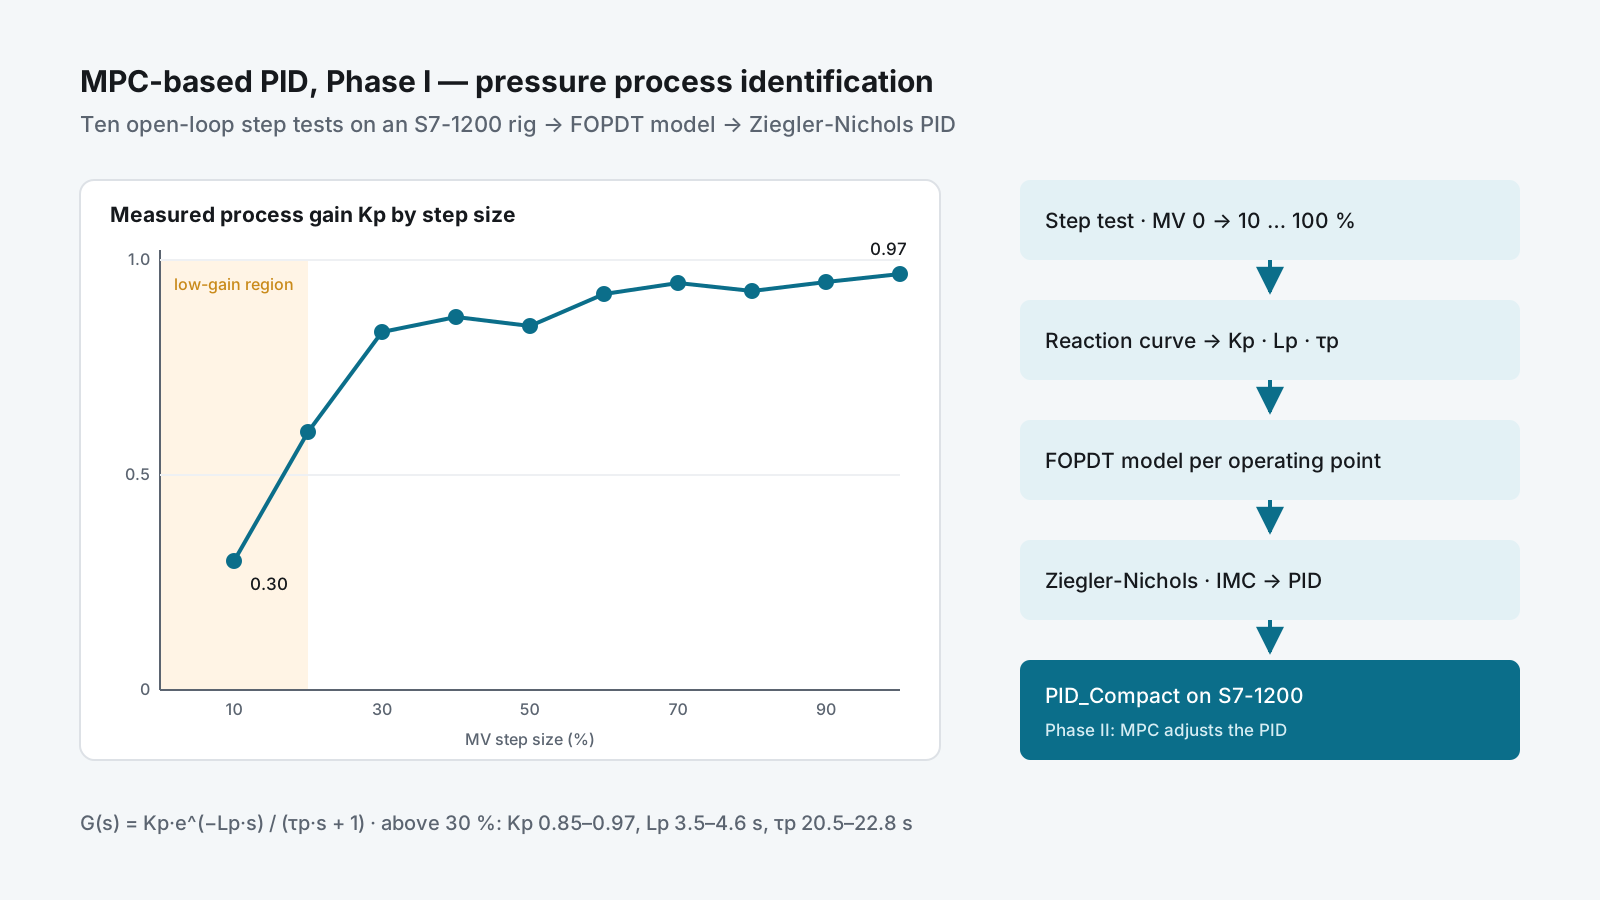
Process gain measured at ten valve openings — low below 20 % and steady between 0.85 and 0.97 above 30 % — beside the step-test-to-PID tuning pipeline.

Highlights

  • Ten open-loop step tests, from 10 % to 100 % valve output, each turned into Kp, dead time and time constant
  • Process gain moved from 0.3 to 0.97 across the range — the case for MPC-based PID in Phase II
  • Ziegler-Nichols PI and PID settings calculated for every operating point; tuned loop run on PID_Compact
  • Test data logged to CSV through an IoT2050 gateway for later analysis

Problem

Most PID loops in industry are tuned by trial and error, once, at one operating point. Model predictive control (MPC) handles changing process behaviour much better, but it needs a model, and it is rarely put on the PLCs and SCADA systems that plants already have.

The thesis asked how far that can be done with standard industrial hardware. Phase I built the foundation on a real pressure loop: measure how the process behaves across its range, turn that into a model, and tune PID from the model — the baseline an MPC-based PID controller in Phase II would be compared against.

My role & scope

B.Eng. thesis in Chemical Process Engineering and Technology at KMUTNB, as a team of three students. Work on the pressure-process rig:

  • Open-loop step tests and the process-parameter calculations
  • First-order-plus-dead-time model of the pressure process
  • PID settings by Ziegler-Nichols, with Internal Model Control (IMC) set up as the comparison method
  • Running the tuned loop on the PLC and recording the trends

The rig: a control valve as the actuator and a pressure transmitter as the measurement, controlled by a Siemens S7-1200 with a WinCC Unified Comfort Panel, and a SIMATIC IoT2050 gateway logging the data to CSV.

Approach

Where MPC fits

The control architecture has four layers — field, automation, management and supervisory. Phase I covers the bottom two: the valve and transmitter, and the PLC with its operator panel. In Phase II, MPC runs at the supervisory level and adjusts the PID in the PLC — a hierarchical structure taken from published work on MPC-based PID for industrial plants.

Model the process

The pressure process was described with a mass balance, taken to the Laplace domain, and reduced to a first-order-plus-dead-time model:

G(s) = Kp · e^(−Lp·s) / (τp·s + 1)

Step tests across the whole range

With the controller in manual, the output was stepped from 0 % to each of 10, 20 … 100 %. From each reaction curve: the process gain Kp = ΔPV % / ΔMV %, the dead time Lp from the tangent at the steepest point, and the time constant τp at 63 % of the change.

Step (MV %) Kp Lp (s) τp (s) ZN PID: PB % Ti (s) Td (s)
0 → 20 0.60 4.38 23.3 9.4 8.8 2.2
0 → 40 0.87 3.84 20.9 13.3 7.7 1.9
0 → 60 0.92 3.65 21.1 13.2 7.3 1.8
0 → 80 0.93 3.50 20.5 13.1 7.0 1.8
0 → 100 0.97 3.80 21.7 14.0 7.6 1.9

Selected rows from ten tests. Ziegler-Nichols open-loop rules: PB % = 83·Kp·Lp/τp, Ti = 2·Lp, Td = 0.5·Lp.

Tune and run it on the PLC

The settings were loaded into PID_Compact in TIA Portal V17 and the loop was run against a 50 % setpoint, with the reaction curve and the closed-loop response recorded on the PLC trend.

Delivery

  • Ten step tests with the full parameter table and Ziegler-Nichols PI and PID settings for each
  • Recorded reaction curve (ΔMV = 50 %) and the tuned closed-loop response on PID_Compact
  • Thesis presentation, revision 1, February 2023, with the methodology for Phase II
  • A public video of the work on the rig

Result

  • Above 30 % valve output the process is consistent — Kp 0.85–0.97, Lp 3.5–4.6 s, τp 20.5–22.8 s — and one PID tuning (PB ≈ 13–16 %, Ti ≈ 7–9 s, Td ≈ 1.8–2.3 s) fits it
  • Below 20 % the gain falls to 0.3–0.6, so a PID tuned for the upper range is too gentle there: the measured evidence for adding MPC on top of PID in Phase II
  • The habit this project started — measure the process, then tune from a model — runs through my later work: the PID tuning tool and the digital twin rig

Skills used

Process modelling (mass balance, Laplace, FOPDT) · open-loop step testing and reaction-curve analysis · Ziegler-Nichols and IMC PID tuning · Siemens S7-1200, TIA Portal V17 and PID_Compact · WinCC Unified · SIMATIC IoT2050 data logging · model predictive control concepts.

  • #Process control
  • #PLC
  • #Data
  • #Education