Process control — commissioning tools
Process Identification & PID Tuning Tool
A web tool that fits a FOPDT model to step-test data from the plant historian and turns it into IMC-tuned controller settings, with fit quality reported.
- Role
- Sole designer and developer
- Company
- MIAC Automation
- Period
- Jun 2025 – Oct 2025
- Platforms
- Python · SciPy · pandas · Plotly · Streamlit · InfluxDB
Highlights
- FOPDT fit seeded from the graphical 28.3 % / 63.2 % method, then refined
- Every tuning result is reported with R² and RMSE
- Multiple step tests compared side by side to track loop health
Problem
PID loops on plant get tuned by feel. An engineer bumps the output, watches the trend, adjusts a gain, and moves on. The result is undocumented, unrepeatable, and impossible to compare between loops or between commissioning visits.
Meanwhile the data needed to do it properly is already being historised — the step tests are recorded, nobody analyses them.
My role & scope
Sole designer and developer: the numerical core, the historian queries and the web interface. Used for analysis of cascade control loops.
Approach
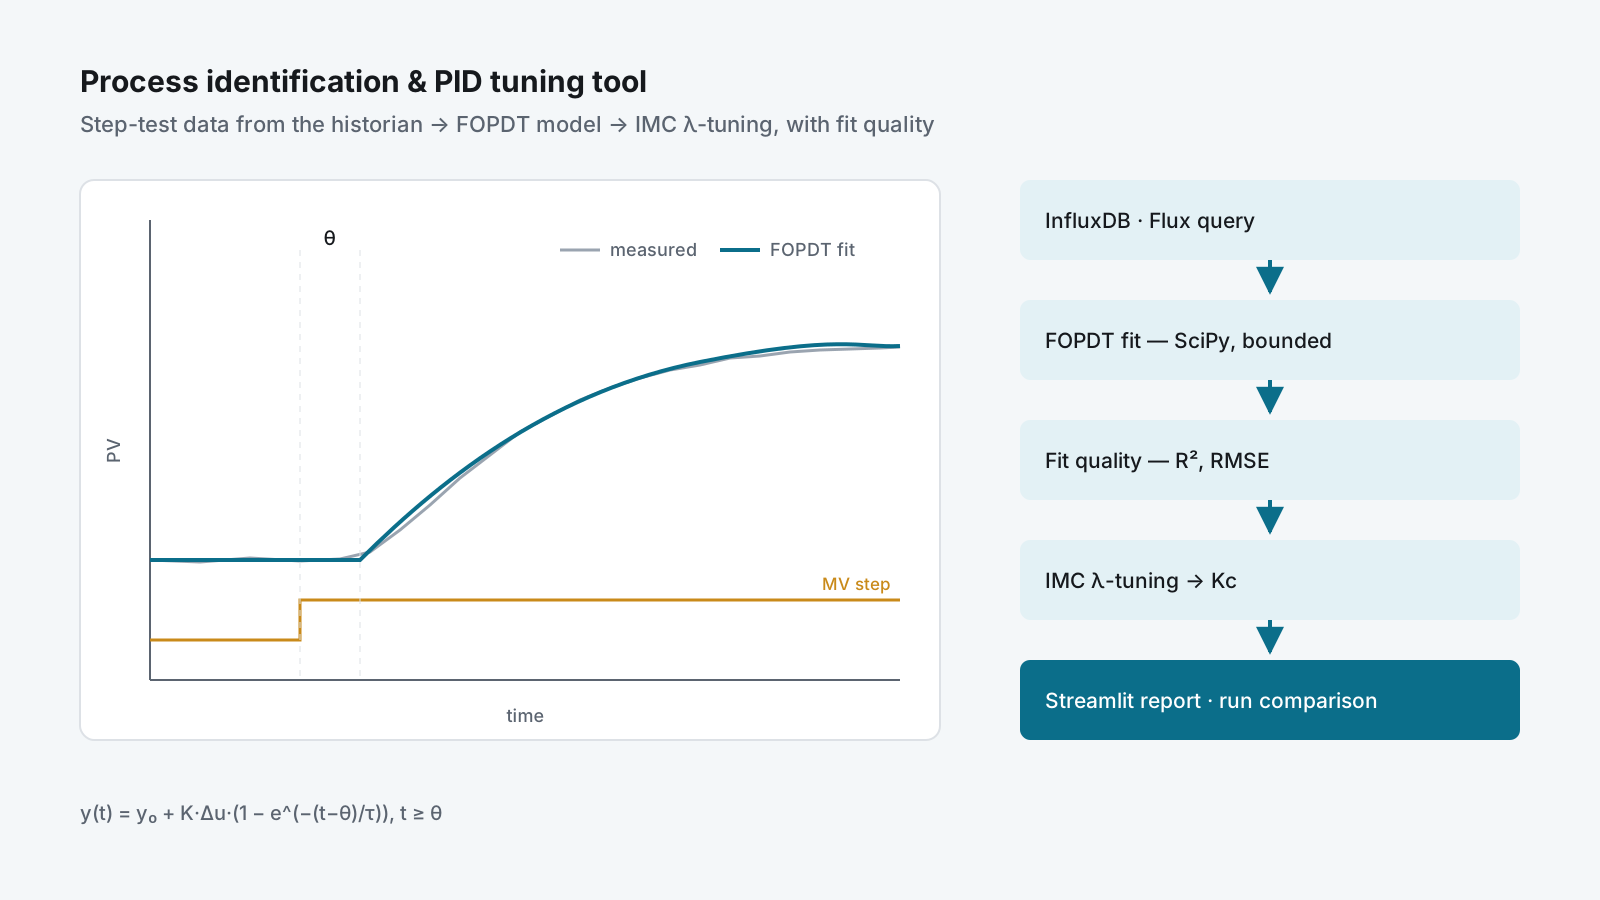
A web tool that reads step-test data straight out of the process historian, fits a first-order plus dead-time model to it, reports how good the fit actually is, and produces tuning parameters from that model.
InfluxDB (Flux query)  →  step-response series
        ↓
FOPDT model fit (SciPy curve_fit, bounded, seeded)
        ↓
Fit quality (R², RMSE)  +  performance metrics
        ↓
IMC λ-tuning  →  controller gain
        ↓
Multi-run comparison table + overlaid Plotly trends
Model identification
The process is fitted to a first-order plus dead-time model:
y(t) = y₀ + K·Δu·(1 − e^(−(t−θ)/τ)) for t ≥ θRather than throwing the raw data at an optimiser and hoping, the fit is seeded from a classical graphical estimate — the 28.3 % and 63.2 % response crossings give a starting τ and θ — and then refined by bounded non-linear least squares. Bounds keep the gain sign consistent with the move direction and keep dead time physically plausible. If the optimiser fails to converge, the tool falls back to the graphical estimate rather than returning nothing.
Reported metrics
| Group | Values |
|---|---|
| Model | K (process gain), τ (time constant), θ (dead time) |
| Fit quality | R², RMSE — is this model worth trusting? |
| Tuning | λ (IMC filter time), Kc (controller gain) |
| Response | rise time (10→90 %), settling time (±2 %), overshoot %, error at 3τ |
| Test conditions | MV before/after, ΔMV, PV before/after |
A tuning number without an R² beside it is an opinion; with one, it is a measurement.
Comparison workflow
Multiple runs are loaded as named tests, each with its own measurement, field and time window, then compared side by side in one table with trends overlaid. That answers “did this loop degrade since last year?” and “which of these tuning candidates is actually better?” with evidence. The λ factor is adjustable, so the speed-versus-robustness trade-off is a visible choice.
Delivery
Working tool, used for analysis of cascade control loops. Planned hardening:
- Configuration via environment variables rather than in-code defaults
- Type hints and a
pytestsuite over the numerical core - Core library separated from the Streamlit UI so it can be called from a pipeline
- Containerised deployment alongside the historian
Result
- Loop tuning backed by a fitted model and a fit-quality figure, not by feel
- A record of each step test that survives the site visit
- Side-by-side comparison of runs to see loop degradation over time
Skills used
Process control theory (FOPDT identification, IMC λ-tuning, cascade loops) · Python — SciPy, pandas, Plotly, Streamlit · InfluxDB / Flux · turning control theory into a tool commissioning engineers can use on site.