Process control research — pressure loop
B.Eng. Thesis — MPC-Based PID Control of a Pressure Process (Phase I)
Identified a real pressure loop from ten step tests on an S7-1200 rig, tuned PID_Compact from the fitted model, and showed why one fixed PID cannot cover the whole operating range.
- Role
- Thesis team of three — step tests, process model and PID tuning on the rig
- Company
- KMUTNB — B.Eng. thesis
- Period
- Jun 2022 – Mar 2023
- Platforms
- Siemens S7-1200 · TIA Portal V17 (PID_Compact) · WinCC Unified Comfort Panel · SIMATIC IoT2050 · Factory I/O
Highlights
- Ten open-loop step tests, from 10 % to 100 % valve output, each turned into Kp, dead time and time constant
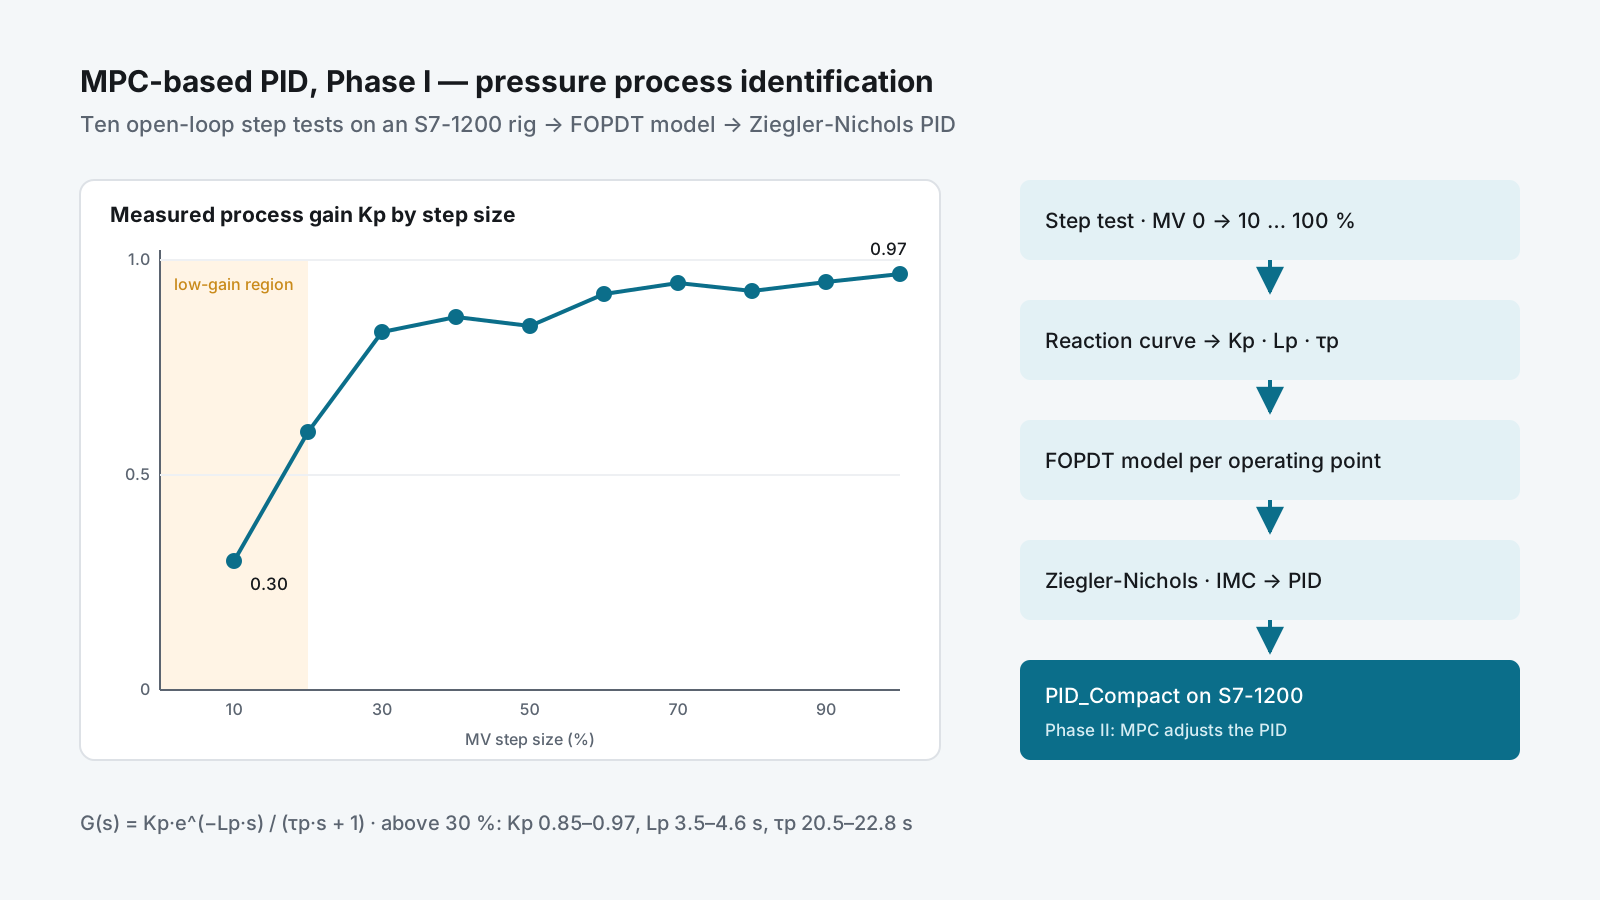
- Process gain moved from 0.3 to 0.97 across the range — the case for MPC-based PID in Phase II
- Ziegler-Nichols PI and PID settings calculated for every operating point; tuned loop run on PID_Compact
- Test data logged to CSV through an IoT2050 gateway for later analysis
Problem
Most PID loops in industry are tuned by trial and error, once, at one operating point. Model predictive control (MPC) handles changing process behaviour much better, but it needs a model, and it is rarely put on the PLCs and SCADA systems that plants already have.
The thesis asked how far that can be done with standard industrial hardware. Phase I built the foundation on a real pressure loop: measure how the process behaves across its range, turn that into a model, and tune PID from the model — the baseline an MPC-based PID controller in Phase II would be compared against.
My role & scope
B.Eng. thesis in Chemical Process Engineering and Technology at KMUTNB, as a team of three students. Work on the pressure-process rig:
- Open-loop step tests and the process-parameter calculations
- First-order-plus-dead-time model of the pressure process
- PID settings by Ziegler-Nichols, with Internal Model Control (IMC) set up as the comparison method
- Running the tuned loop on the PLC and recording the trends
The rig: a control valve as the actuator and a pressure transmitter as the measurement, controlled by a Siemens S7-1200 with a WinCC Unified Comfort Panel, and a SIMATIC IoT2050 gateway logging the data to CSV.
Approach
Where MPC fits
The control architecture has four layers — field, automation, management and supervisory. Phase I covers the bottom two: the valve and transmitter, and the PLC with its operator panel. In Phase II, MPC runs at the supervisory level and adjusts the PID in the PLC — a hierarchical structure taken from published work on MPC-based PID for industrial plants.
Model the process
The pressure process was described with a mass balance, taken to the Laplace domain, and reduced to a first-order-plus-dead-time model:
G(s) = Kp · e^(−Lp·s) / (τp·s + 1)Step tests across the whole range
With the controller in manual, the output was stepped from 0 % to each of 10, 20 … 100 %. From each
reaction curve: the process gain Kp = ΔPV % / ΔMV %, the dead time Lp from the tangent at the
steepest point, and the time constant τp at 63 % of the change.
| Step (MV %) | Kp | Lp (s) | τp (s) | ZN PID: PB % | Ti (s) | Td (s) |
|---|---|---|---|---|---|---|
| 0 → 20 | 0.60 | 4.38 | 23.3 | 9.4 | 8.8 | 2.2 |
| 0 → 40 | 0.87 | 3.84 | 20.9 | 13.3 | 7.7 | 1.9 |
| 0 → 60 | 0.92 | 3.65 | 21.1 | 13.2 | 7.3 | 1.8 |
| 0 → 80 | 0.93 | 3.50 | 20.5 | 13.1 | 7.0 | 1.8 |
| 0 → 100 | 0.97 | 3.80 | 21.7 | 14.0 | 7.6 | 1.9 |
Selected rows from ten tests. Ziegler-Nichols open-loop rules: PB % = 83·Kp·Lp/τp, Ti = 2·Lp, Td = 0.5·Lp.
Tune and run it on the PLC
The settings were loaded into PID_Compact in TIA Portal V17 and the loop was run against a 50 % setpoint, with the reaction curve and the closed-loop response recorded on the PLC trend.
Delivery
- Ten step tests with the full parameter table and Ziegler-Nichols PI and PID settings for each
- Recorded reaction curve (ΔMV = 50 %) and the tuned closed-loop response on PID_Compact
- Thesis presentation, revision 1, February 2023, with the methodology for Phase II
- A public video of the work on the rig
Result
- Above 30 % valve output the process is consistent —
Kp0.85–0.97,Lp3.5–4.6 s,τp20.5–22.8 s — and one PID tuning (PB ≈ 13–16 %, Ti ≈ 7–9 s, Td ≈ 1.8–2.3 s) fits it - Below 20 % the gain falls to 0.3–0.6, so a PID tuned for the upper range is too gentle there: the measured evidence for adding MPC on top of PID in Phase II
- The habit this project started — measure the process, then tune from a model — runs through my later work: the PID tuning tool and the digital twin rig
Skills used
Process modelling (mass balance, Laplace, FOPDT) · open-loop step testing and reaction-curve analysis · Ziegler-Nichols and IMC PID tuning · Siemens S7-1200, TIA Portal V17 and PID_Compact · WinCC Unified · SIMATIC IoT2050 data logging · model predictive control concepts.